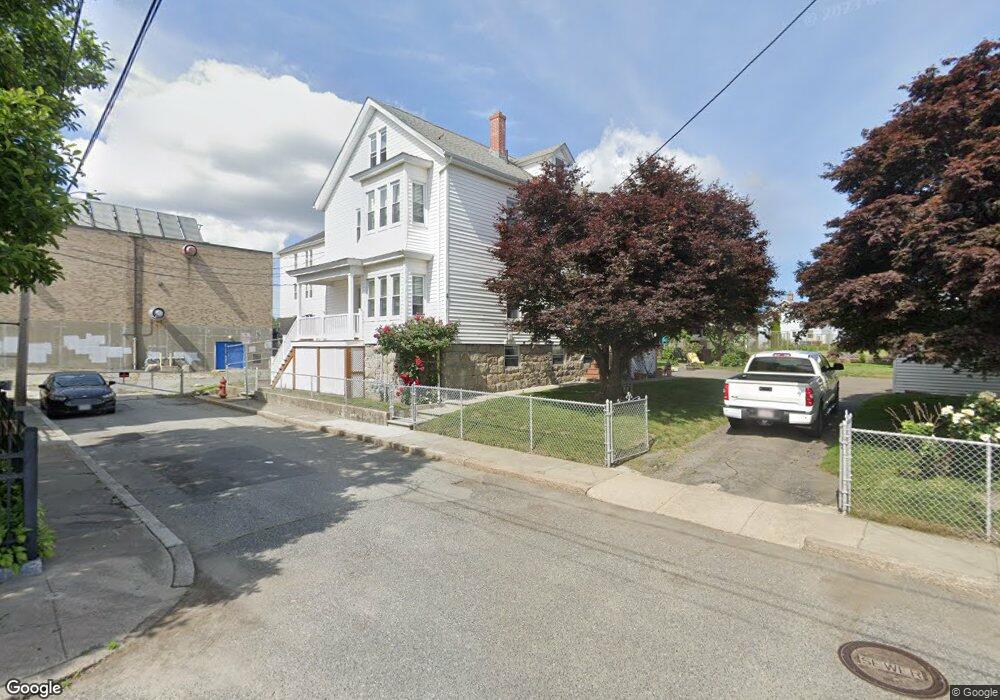
4 Cross St Fall River, MA 02723
Flint NeighborhoodEstimated Value: $437,000 - $517,186
5
Beds
2
Baths
2,232
Sq Ft
$220/Sq Ft
Est. Value
About This Home
This home is located at 4 Cross St, Fall River, MA 02723 and is currently estimated at $491,047, approximately $220 per square foot. 4 Cross St is a home located in Bristol County with nearby schools including Mary Fonseca Elementary School, Talbot Innovation School, and B M C Durfee High School.
Ownership History
Date
Name
Owned For
Owner Type
Purchase Details
Closed on
Aug 1, 2007
Sold by
Shay Elizabeth Ann and Shay Jacqueline
Bought by
Moniz Ana M and Moniz Duarte M
Current Estimated Value
Home Financials for this Owner
Home Financials are based on the most recent Mortgage that was taken out on this home.
Original Mortgage
$200,000
Outstanding Balance
$127,082
Interest Rate
6.73%
Mortgage Type
Purchase Money Mortgage
Estimated Equity
$363,965
Purchase Details
Closed on
May 9, 2003
Sold by
Shay Jacqueline T and Shay Jacqueline
Bought by
Shay Elizabeth Ann R and Shay Jacqueline Life
Create a Home Valuation Report for This Property
The Home Valuation Report is an in-depth analysis detailing your home's value as well as a comparison with similar homes in the area
Home Values in the Area
Average Home Value in this Area
Purchase History
| Date | Buyer | Sale Price | Title Company |
|---|---|---|---|
| Moniz Ana M | $250,000 | -- | |
| Shay Elizabeth Ann R | -- | -- |
Source: Public Records
Mortgage History
| Date | Status | Borrower | Loan Amount |
|---|---|---|---|
| Open | Moniz Ana M | $200,000 |
Source: Public Records
Tax History
| Year | Tax Paid | Tax Assessment Tax Assessment Total Assessment is a certain percentage of the fair market value that is determined by local assessors to be the total taxable value of land and additions on the property. | Land | Improvement |
|---|---|---|---|---|
| 2025 | $4,881 | $426,300 | $111,400 | $314,900 |
| 2024 | $4,471 | $389,100 | $107,300 | $281,800 |
| 2023 | $4,072 | $331,900 | $88,600 | $243,300 |
| 2022 | $3,778 | $299,400 | $84,400 | $215,000 |
| 2021 | $3,492 | $252,500 | $80,300 | $172,200 |
| 2020 | $3,147 | $217,800 | $79,100 | $138,700 |
| 2019 | $2,987 | $204,900 | $76,200 | $128,700 |
| 2018 | $2,728 | $186,600 | $82,500 | $104,100 |
| 2017 | $2,484 | $177,400 | $78,700 | $98,700 |
| 2016 | $2,453 | $180,000 | $83,700 | $96,300 |
| 2015 | $2,354 | $180,000 | $83,700 | $96,300 |
| 2014 | $2,337 | $185,800 | $81,300 | $104,500 |
Source: Public Records
Map
Nearby Homes
- 139 Quarry St
- 869 Bedford St
- 84 Healy St
- 105 16th St
- 120 15th St Unit 5
- 10 Carlisa Dr
- 129 County St
- 847 Pleasant St
- 992 Pine St
- 217 Plain St
- 218 Plain St
- 1155-1157 Pleasant St
- 88 Harrison St Unit 5
- 1244 Pleasant St
- 70 Jencks St
- 884 Cherry St
- 273 Tremont St
- 243 Robeson St Unit 6
- 243 Robeson St Unit 3
- 243 Oak Grove Ave
- 45 Quarry St
- 6 Fruit St
- 67 Quarry St
- 41 Quarry St
- 55 Quarry St
- 1 Cross St
- 31 Cross St
- 31 Cross St Unit 3
- 31 Cross St Unit 2
- 83 Quarry St Unit 2E
- 83 Quarry St Unit 3W
- 83 Quarry St Unit 1E
- 83 Quarry St
- 83 Quarry St Unit 2W
- 39 Quarry St
- 7 Fruit St
- 23 Fruit St
- 78 18th St
- 78 18th St Unit 3
- 825 Bedford St
Your Personal Tour Guide
Ask me questions while you tour the home.