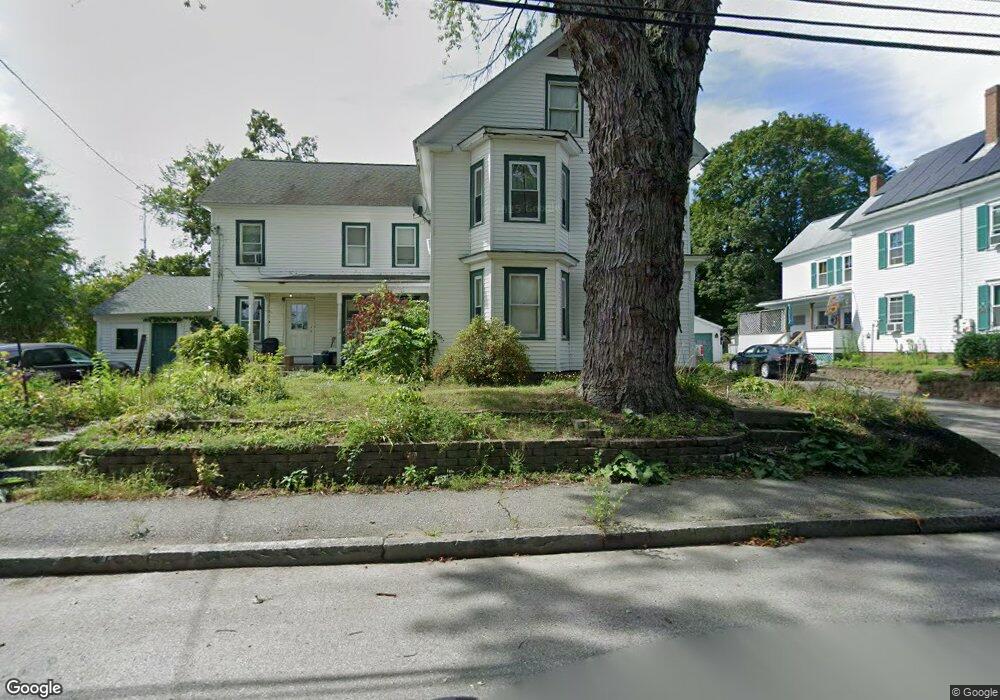
4 Cross St Pepperell, MA 01463
Estimated Value: $477,000 - $581,000
3
Beds
4
Baths
2,392
Sq Ft
$226/Sq Ft
Est. Value
About This Home
This home is located at 4 Cross St, Pepperell, MA 01463 and is currently estimated at $541,541, approximately $226 per square foot. 4 Cross St is a home located in Middlesex County with nearby schools including North Middlesex Regional High School, Pepperell Christian Academy, and Maple Dene & Moppet School.
Ownership History
Date
Name
Owned For
Owner Type
Purchase Details
Closed on
Jul 30, 2024
Sold by
Nelson David H and Nelson Jennifer L
Bought by
Duchess Ft and Nelson
Current Estimated Value
Purchase Details
Closed on
Jul 18, 2000
Sold by
Dobens Betty A
Bought by
Nelson David H and Nelson Jennifer L
Home Financials for this Owner
Home Financials are based on the most recent Mortgage that was taken out on this home.
Original Mortgage
$105,000
Interest Rate
8.5%
Mortgage Type
Purchase Money Mortgage
Create a Home Valuation Report for This Property
The Home Valuation Report is an in-depth analysis detailing your home's value as well as a comparison with similar homes in the area
Home Values in the Area
Average Home Value in this Area
Purchase History
| Date | Buyer | Sale Price | Title Company |
|---|---|---|---|
| Duchess Ft | -- | None Available | |
| Duchess Ft | -- | None Available | |
| Nelson David H | $150,000 | -- |
Source: Public Records
Mortgage History
| Date | Status | Borrower | Loan Amount |
|---|---|---|---|
| Previous Owner | Nelson David H | $143,000 | |
| Previous Owner | Nelson David H | $125,000 | |
| Previous Owner | Nelson David H | $105,000 | |
| Previous Owner | Nelson David H | $25,000 |
Source: Public Records
Tax History
| Year | Tax Paid | Tax Assessment Tax Assessment Total Assessment is a certain percentage of the fair market value that is determined by local assessors to be the total taxable value of land and additions on the property. | Land | Improvement |
|---|---|---|---|---|
| 2025 | $6,980 | $477,100 | $124,900 | $352,200 |
| 2024 | $6,676 | $465,200 | $113,000 | $352,200 |
| 2023 | $6,406 | $423,100 | $113,000 | $310,100 |
| 2022 | $6,375 | $371,700 | $101,100 | $270,600 |
| 2021 | $6,387 | $356,400 | $89,200 | $267,200 |
| 2020 | $6,086 | $358,400 | $89,200 | $269,200 |
| 2019 | $5,519 | $332,700 | $89,200 | $243,500 |
| 2018 | $4,510 | $298,000 | $89,200 | $208,800 |
| 2017 | $4,245 | $278,000 | $83,200 | $194,800 |
| 2016 | $4,372 | $264,500 | $83,200 | $181,300 |
| 2015 | $4,219 | $264,500 | $83,200 | $181,300 |
| 2014 | $4,112 | $259,300 | $83,200 | $176,100 |
Source: Public Records
Map
Nearby Homes
- 38 River Rd Unit 11
- 39 Hollis St Unit A
- 10 Bennett St
- 28-30 Groton St
- 14 Brookline St
- 29 Tarbell St
- 38 Tarbell St Unit 5B
- 38 Tarbell St Unit 1D
- 114 Groton St
- 13 Birch Dr
- 8 Casie Ln
- 27 Merrimac Dr
- 90 Townsend St
- 96 Townsend St
- 208 North St
- 39 Mount Lebanon St
- 179 Wyman Rd
- 18 Maple St Unit 14
- 120 Townsend St Unit 1
- 120 Townsend St Unit 2
Your Personal Tour Guide
Ask me questions while you tour the home.