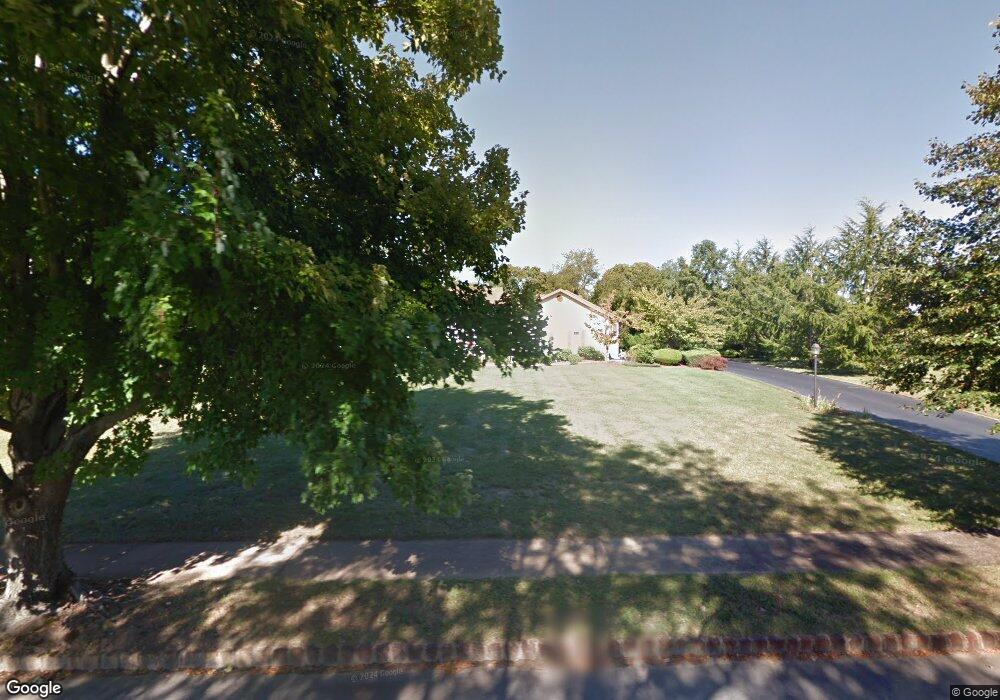
4 Cuomo Ct Millstone Township, NJ 08535
Estimated Value: $859,000 - $1,087,000
3
Beds
4
Baths
2,791
Sq Ft
$346/Sq Ft
Est. Value
About This Home
This home is located at 4 Cuomo Ct, Millstone Township, NJ 08535 and is currently estimated at $964,446, approximately $345 per square foot. 4 Cuomo Ct is a home located in Monmouth County with nearby schools including Millstone Township Primary School, Millstone Township Elementary School, and Millstone Township Middle School.
Ownership History
Date
Name
Owned For
Owner Type
Purchase Details
Closed on
Nov 1, 2002
Sold by
Hall Eddie
Bought by
Campelo Antonio and Campelo Estela
Current Estimated Value
Purchase Details
Closed on
Dec 14, 1998
Sold by
Toscano Rocco
Bought by
Hall Eddie and Hall Lydia
Home Financials for this Owner
Home Financials are based on the most recent Mortgage that was taken out on this home.
Original Mortgage
$274,500
Interest Rate
6.7%
Create a Home Valuation Report for This Property
The Home Valuation Report is an in-depth analysis detailing your home's value as well as a comparison with similar homes in the area
Home Values in the Area
Average Home Value in this Area
Purchase History
| Date | Buyer | Sale Price | Title Company |
|---|---|---|---|
| Campelo Antonio | $432,000 | -- | |
| Hall Eddie | $309,500 | -- |
Source: Public Records
Mortgage History
| Date | Status | Borrower | Loan Amount |
|---|---|---|---|
| Previous Owner | Hall Eddie | $274,500 |
Source: Public Records
Tax History Compared to Growth
Tax History
| Year | Tax Paid | Tax Assessment Tax Assessment Total Assessment is a certain percentage of the fair market value that is determined by local assessors to be the total taxable value of land and additions on the property. | Land | Improvement |
|---|---|---|---|---|
| 2025 | $12,943 | $636,900 | $167,200 | $469,700 |
| 2024 | $13,429 | $540,400 | $173,100 | $367,300 |
| 2023 | $13,429 | $540,400 | $173,100 | $367,300 |
| 2022 | $13,045 | $540,400 | $173,100 | $367,300 |
| 2021 | $13,045 | $540,400 | $173,100 | $367,300 |
| 2020 | $12,899 | $540,400 | $173,100 | $367,300 |
| 2019 | $12,656 | $540,400 | $173,100 | $367,300 |
| 2018 | $12,343 | $540,400 | $173,100 | $367,300 |
| 2017 | $12,289 | $540,400 | $173,100 | $367,300 |
| 2016 | $12,197 | $540,400 | $173,100 | $367,300 |
| 2015 | $11,982 | $504,700 | $173,100 | $331,600 |
| 2014 | $11,874 | $456,500 | $158,100 | $298,400 |
Source: Public Records
Map
Nearby Homes