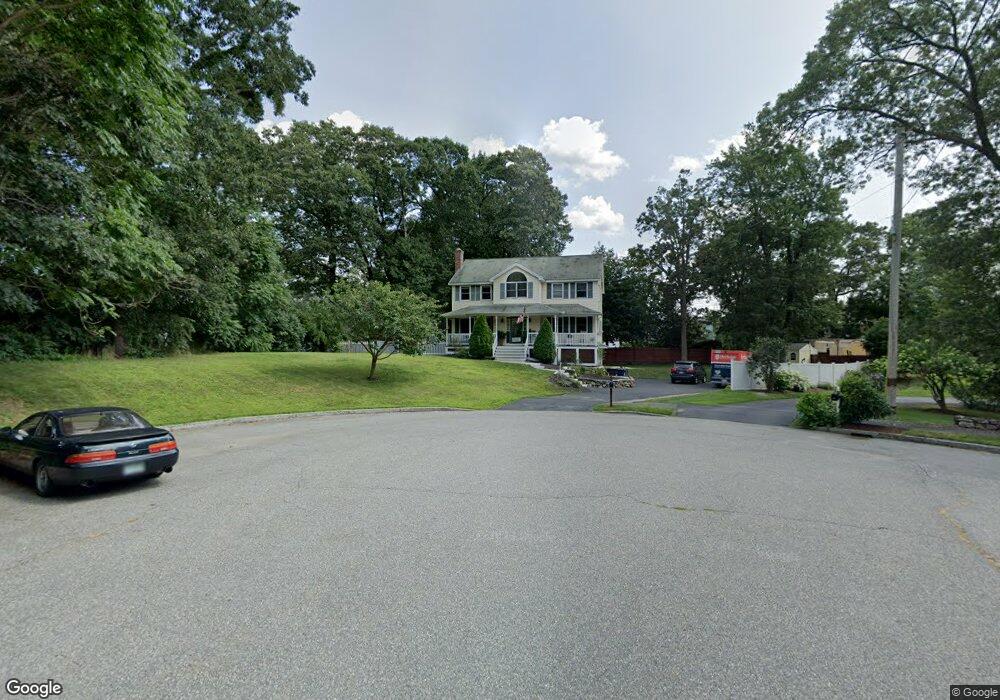
4 Denault Dr Wilmington, MA 01887
Estimated Value: $844,000 - $984,000
4
Beds
3
Baths
2,374
Sq Ft
$384/Sq Ft
Est. Value
About This Home
This home is located at 4 Denault Dr, Wilmington, MA 01887 and is currently estimated at $910,716, approximately $383 per square foot. 4 Denault Dr is a home located in Middlesex County with nearby schools including Wilmington Middle School, Wilmington High School, and Abundant Life Christian School and Childcare.
Ownership History
Date
Name
Owned For
Owner Type
Purchase Details
Closed on
Oct 9, 1998
Sold by
Cs Newhouse Bldrs Inc
Bought by
Stalker John C
Current Estimated Value
Home Financials for this Owner
Home Financials are based on the most recent Mortgage that was taken out on this home.
Original Mortgage
$270,700
Outstanding Balance
$59,370
Interest Rate
6.92%
Mortgage Type
Purchase Money Mortgage
Estimated Equity
$851,346
Create a Home Valuation Report for This Property
The Home Valuation Report is an in-depth analysis detailing your home's value as well as a comparison with similar homes in the area
Purchase History
| Date | Buyer | Sale Price | Title Company |
|---|---|---|---|
| Stalker John C | $300,800 | -- |
Source: Public Records
Mortgage History
| Date | Status | Borrower | Loan Amount |
|---|---|---|---|
| Open | Stalker John C | $36,900 | |
| Open | Stalker John C | $270,700 |
Source: Public Records
Tax History
| Year | Tax Paid | Tax Assessment Tax Assessment Total Assessment is a certain percentage of the fair market value that is determined by local assessors to be the total taxable value of land and additions on the property. | Land | Improvement |
|---|---|---|---|---|
| 2025 | $9,402 | $821,100 | $290,500 | $530,600 |
| 2024 | $9,273 | $811,300 | $290,500 | $520,800 |
| 2023 | $8,655 | $724,900 | $264,100 | $460,800 |
| 2022 | $8,180 | $627,800 | $220,000 | $407,800 |
| 2021 | $8,177 | $590,800 | $199,900 | $390,900 |
| 2020 | $7,912 | $582,600 | $199,900 | $382,700 |
| 2019 | $7,794 | $566,800 | $190,500 | $376,300 |
| 2018 | $7,652 | $531,000 | $181,400 | $349,600 |
| 2017 | $7,476 | $517,400 | $181,400 | $336,000 |
| 2016 | $6,968 | $476,300 | $172,900 | $303,400 |
| 2015 | $6,701 | $466,300 | $172,900 | $293,400 |
| 2014 | $6,283 | $441,200 | $164,700 | $276,500 |
Source: Public Records
Map
Nearby Homes
- 203 Lowell St Unit 316
- 203 Lowell St Unit 218
- 203 Lowell St Unit 120
- 203 Lowell St Unit 206
- 3 Molloy Rd
- 2 Inwood Dr Unit 1005
- 7 Cross St Unit 303
- 7 Cross St Unit 304
- 7 Cross St Unit 205
- 7 Cross St Unit 102
- 584 Woburn St
- 9 Parker St
- 30 Taylor Dr Unit 3011
- 18 Talbot Ln Unit 18
- 1011 Main St Unit 5
- 16 Munroe Ave
- 150 Grove St
- 31 Burlington Ave
- 11 Town Line Rd
- 99 Grove St
Your Personal Tour Guide
Ask me questions while you tour the home.