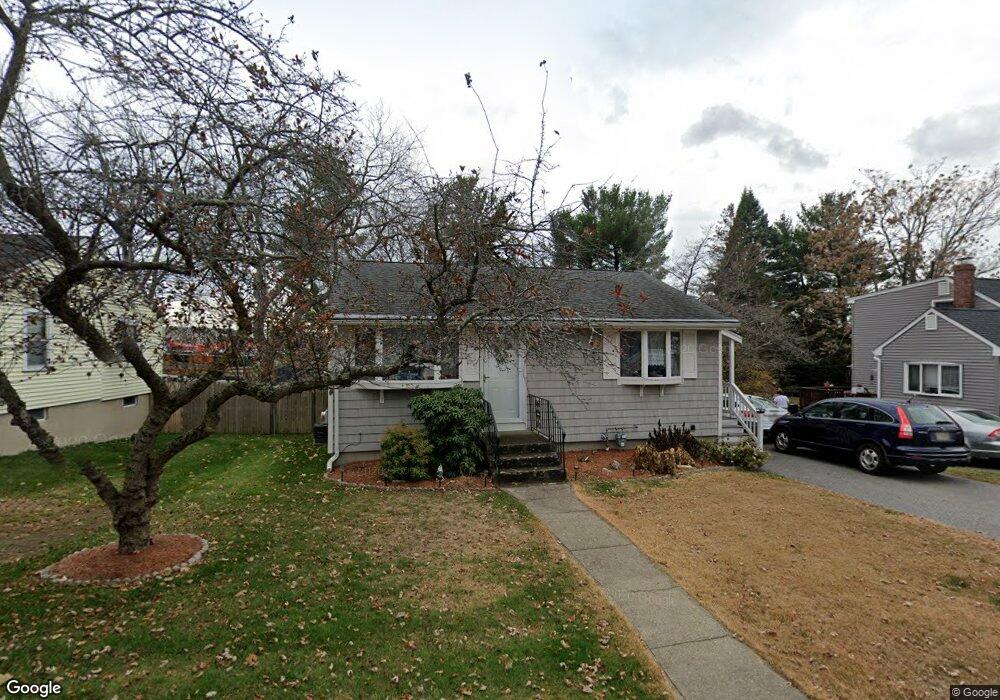
4 Dewey Ave Woburn, MA 01801
Walnut Hill NeighborhoodEstimated Value: $508,000 - $634,000
2
Beds
2
Baths
780
Sq Ft
$737/Sq Ft
Est. Value
About This Home
This home is located at 4 Dewey Ave, Woburn, MA 01801 and is currently estimated at $574,639, approximately $736 per square foot. 4 Dewey Ave is a home located in Middlesex County with nearby schools including Goodyear Elementary School, John F. Kennedy Middle School, and Woburn High School.
Ownership History
Date
Name
Owned For
Owner Type
Purchase Details
Closed on
Dec 15, 2022
Sold by
Young Elizabeth J
Bought by
Elizabeth J Young Ret and Young
Current Estimated Value
Purchase Details
Closed on
Jun 8, 2021
Sold by
Young Heather Est and Young
Bought by
Young Elizabeth J
Purchase Details
Closed on
Jan 8, 2020
Sold by
Young Elizabeth J
Bought by
Young Heather A
Purchase Details
Closed on
Dec 29, 1989
Sold by
Chamberlain Chas R
Bought by
Young James R
Home Financials for this Owner
Home Financials are based on the most recent Mortgage that was taken out on this home.
Original Mortgage
$123,500
Interest Rate
9.61%
Mortgage Type
Purchase Money Mortgage
Create a Home Valuation Report for This Property
The Home Valuation Report is an in-depth analysis detailing your home's value as well as a comparison with similar homes in the area
Home Values in the Area
Average Home Value in this Area
Purchase History
| Date | Buyer | Sale Price | Title Company |
|---|---|---|---|
| Elizabeth J Young Ret | -- | None Available | |
| Elizabeth J Young Ret | -- | None Available | |
| Young Elizabeth J | -- | None Available | |
| Young Elizabeth J | -- | None Available | |
| Young Heather A | -- | None Available | |
| Young Heather A | -- | None Available | |
| Young James R | $130,000 | -- |
Source: Public Records
Mortgage History
| Date | Status | Borrower | Loan Amount |
|---|---|---|---|
| Previous Owner | Young James R | $61,800 | |
| Previous Owner | Young James R | $119,700 | |
| Previous Owner | Young James R | $123,500 |
Source: Public Records
Tax History
| Year | Tax Paid | Tax Assessment Tax Assessment Total Assessment is a certain percentage of the fair market value that is determined by local assessors to be the total taxable value of land and additions on the property. | Land | Improvement |
|---|---|---|---|---|
| 2025 | $4,056 | $474,900 | $257,800 | $217,100 |
| 2024 | $3,804 | $471,900 | $245,600 | $226,300 |
| 2023 | $3,845 | $442,000 | $223,200 | $218,800 |
| 2022 | $3,757 | $402,200 | $194,100 | $208,100 |
| 2021 | $3,547 | $380,200 | $184,900 | $195,300 |
| 2020 | $3,335 | $357,800 | $184,900 | $172,900 |
| 2019 | $3,155 | $332,100 | $176,100 | $156,000 |
| 2018 | $2,973 | $300,600 | $161,500 | $139,100 |
| 2017 | $2,890 | $290,700 | $153,900 | $136,800 |
| 2016 | $2,757 | $274,300 | $143,800 | $130,500 |
| 2015 | $2,651 | $260,700 | $134,400 | $126,300 |
| 2014 | $2,401 | $230,000 | $134,400 | $95,600 |
Source: Public Records
Map
Nearby Homes
- 84 Curtis St
- 57 Augustus Ct Unit 1010
- 36 Augustus Ct Unit 2012
- 33 Old Farm Rd
- 74 Beach St Unit 1-1
- 20 Hilltop Terrace
- 23 Buttaro Rd
- 14 Forest Park Rd
- 0 Fryeburg Rd
- 18 Sherman Place
- 219 Montvale Ae
- 164 Green St
- 11 Isola Ln
- 66 Main St Unit 48A
- 159 Main St Unit 47C
- 159 Main St Unit 52B
- 159 Main St Unit 11B
- 100 Ledgewood Dr Unit 410
- 6 Stratton Dr Unit 3303
- 16 Munroe Ave
- 6 Dewey Ave
- 2 Dewey Ave
- 3 Dewey Ave
- 10 Dewey Ave
- 1 Dewey Ave
- 7 Dewey Ave
- 5 Hobson Ave
- 12 Dewey Ave
- 376B Washington St Unit B
- 376 Washington St
- 9 Dewey Ave
- 14 Dewey Ave
- 218 W Cummings Park Unit 218
- 3 Hobson Ave
- 5 Wainwright Ave
- 378 Washington St
- 12 Olympia Ave
- 11 Dewey Ave
- 210 W Cummings Park
- 16 Olympia Ave
Your Personal Tour Guide
Ask me questions while you tour the home.