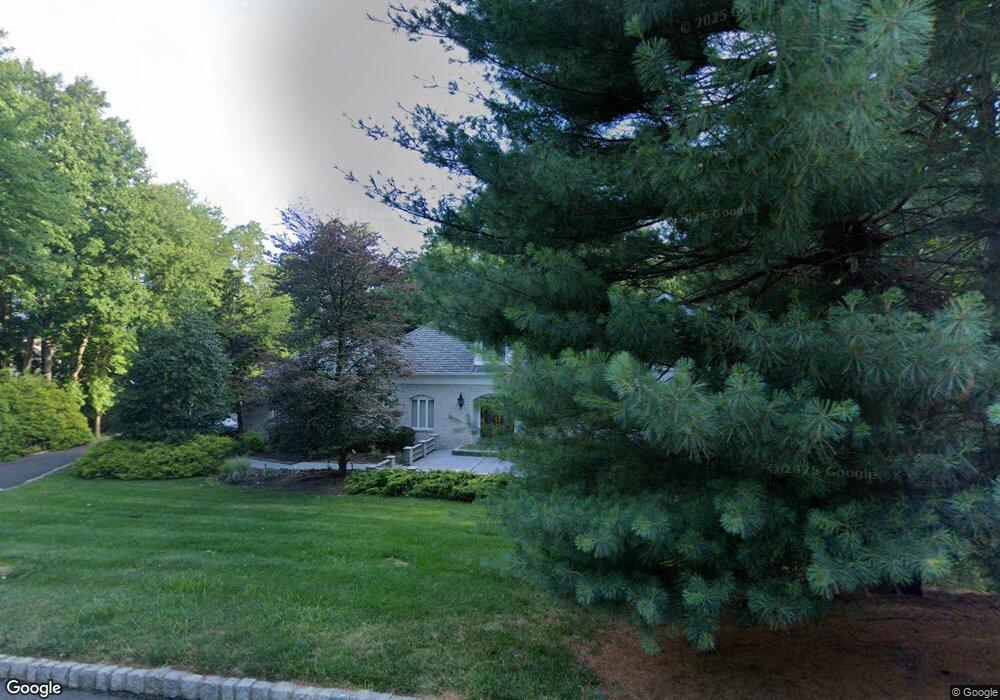
4 Doughill Ct Holmdel, NJ 07733
Estimated Value: $1,373,000 - $1,829,000
4
Beds
4
Baths
4,154
Sq Ft
$395/Sq Ft
Est. Value
About This Home
This home is located at 4 Doughill Ct, Holmdel, NJ 07733 and is currently estimated at $1,642,786, approximately $395 per square foot. 4 Doughill Ct is a home located in Monmouth County with nearby schools including Village School, Indian Hill Elementary School, and William Satz Intermediate School.
Ownership History
Date
Name
Owned For
Owner Type
Purchase Details
Closed on
Aug 8, 2000
Sold by
Kolber George
Bought by
Fishlin Jerrold and Fishlin Michelle
Current Estimated Value
Home Financials for this Owner
Home Financials are based on the most recent Mortgage that was taken out on this home.
Original Mortgage
$300,000
Outstanding Balance
$108,085
Interest Rate
8.13%
Estimated Equity
$1,534,701
Purchase Details
Closed on
Apr 28, 1995
Sold by
Daiker Jonathan
Bought by
Kolber George and Kolber Vita
Home Financials for this Owner
Home Financials are based on the most recent Mortgage that was taken out on this home.
Original Mortgage
$700,000
Interest Rate
8.36%
Create a Home Valuation Report for This Property
The Home Valuation Report is an in-depth analysis detailing your home's value as well as a comparison with similar homes in the area
Home Values in the Area
Average Home Value in this Area
Purchase History
| Date | Buyer | Sale Price | Title Company |
|---|---|---|---|
| Fishlin Jerrold | $950,000 | -- | |
| Kolber George | $795,000 | -- |
Source: Public Records
Mortgage History
| Date | Status | Borrower | Loan Amount |
|---|---|---|---|
| Open | Fishlin Jerrold | $300,000 | |
| Previous Owner | Kolber George | $700,000 |
Source: Public Records
Tax History Compared to Growth
Tax History
| Year | Tax Paid | Tax Assessment Tax Assessment Total Assessment is a certain percentage of the fair market value that is determined by local assessors to be the total taxable value of land and additions on the property. | Land | Improvement |
|---|---|---|---|---|
| 2025 | $21,980 | $1,513,000 | $508,800 | $1,004,200 |
| 2024 | $21,447 | $1,394,700 | $470,400 | $924,300 |
| 2023 | $21,447 | $1,318,200 | $429,300 | $888,900 |
| 2022 | $20,213 | $1,113,700 | $383,300 | $730,400 |
| 2021 | $20,213 | $1,057,500 | $325,600 | $731,900 |
| 2020 | $20,682 | $1,014,300 | $330,300 | $684,000 |
| 2019 | $21,181 | $1,043,900 | $319,300 | $724,600 |
| 2018 | $21,368 | $1,057,300 | $291,300 | $766,000 |
| 2017 | $21,970 | $1,082,800 | $277,400 | $805,400 |
| 2016 | $21,474 | $1,070,500 | $267,900 | $802,600 |
| 2015 | $21,115 | $1,056,300 | $267,900 | $788,400 |
| 2014 | $19,602 | $937,900 | $358,200 | $579,700 |
Source: Public Records
Map
Nearby Homes
- 16 S Beers St
- 750 Holmdel Rd
- 798 Holmdel Rd
- 1 Davey Place
- 748 Holmdel Rd
- 830 & 832 Holmdel Rd
- 832 Holmdel Rd
- 3 Tolas Dr
- 830 Holmdel Rd
- 672 N Beers St
- 15 Goldsmith Dr
- 34 Line Rd
- 11 Chestnut Ridge Rd
- 101 Cresci Blvd
- 29 Telegraph Hill Rd
- 11 Goldsmith Dr
- 7 Kaylen Place
- 9 Tralee Rd
- 9 Jubilee Cir
- 10 Deer St