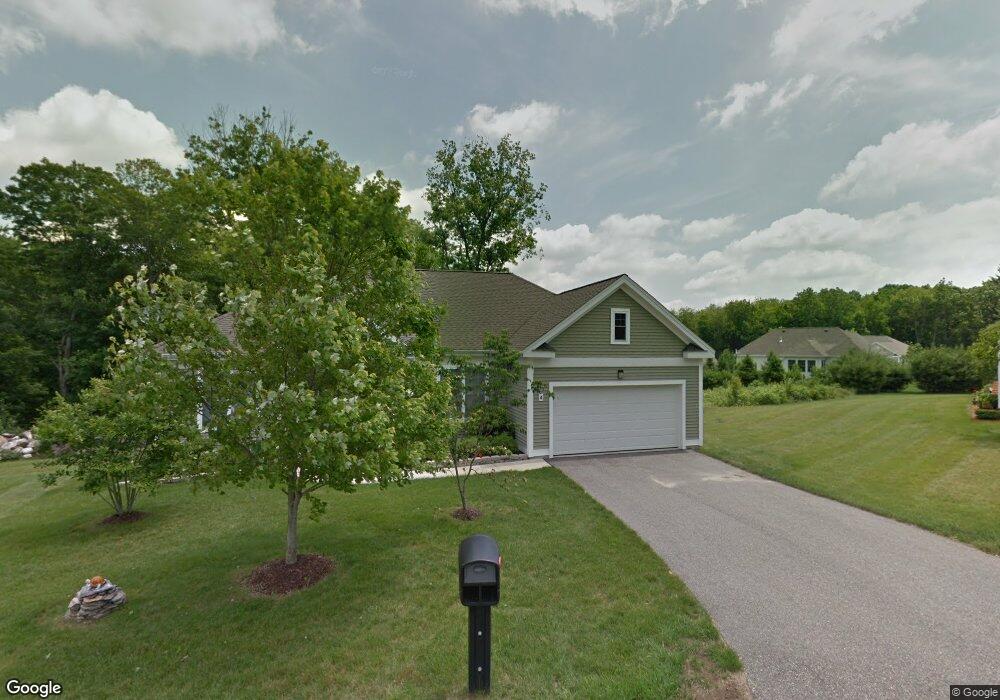
4 Dover Ln Columbia, CT 06237
Estimated Value: $404,000 - $510,000
2
Beds
2
Baths
1,800
Sq Ft
$246/Sq Ft
Est. Value
About This Home
This home is located at 4 Dover Ln, Columbia, CT 06237 and is currently estimated at $441,930, approximately $245 per square foot. 4 Dover Ln is a home located in Tolland County with nearby schools including Horace W. Porter School.
Ownership History
Date
Name
Owned For
Owner Type
Purchase Details
Closed on
Apr 15, 2019
Sold by
Wingertsman Pauline A
Bought by
Pauline A Wingertsman Ret
Current Estimated Value
Purchase Details
Closed on
Jul 16, 2007
Sold by
Birmingham John and Birmingham Dolores
Bought by
Wingertsman Pauline
Home Financials for this Owner
Home Financials are based on the most recent Mortgage that was taken out on this home.
Original Mortgage
$131,000
Interest Rate
6.48%
Purchase Details
Closed on
Sep 29, 2005
Sold by
Bisi Robert and Bisi Lynne
Bought by
Birmingham John and Birmingham Dolores
Purchase Details
Closed on
May 4, 2004
Sold by
Benton Farm Assoc
Bought by
Bisi Robert
Create a Home Valuation Report for This Property
The Home Valuation Report is an in-depth analysis detailing your home's value as well as a comparison with similar homes in the area
Home Values in the Area
Average Home Value in this Area
Purchase History
| Date | Buyer | Sale Price | Title Company |
|---|---|---|---|
| Pauline A Wingertsman Ret | -- | -- | |
| Wingertsman Pauline | $315,000 | -- | |
| Birmingham John | $315,000 | -- | |
| Bisi Robert | $273,805 | -- |
Source: Public Records
Mortgage History
| Date | Status | Borrower | Loan Amount |
|---|---|---|---|
| Previous Owner | Bisi Robert | $104,000 | |
| Previous Owner | Bisi Robert | $110,510 | |
| Previous Owner | Bisi Robert | $131,000 |
Source: Public Records
Tax History Compared to Growth
Tax History
| Year | Tax Paid | Tax Assessment Tax Assessment Total Assessment is a certain percentage of the fair market value that is determined by local assessors to be the total taxable value of land and additions on the property. | Land | Improvement |
|---|---|---|---|---|
| 2025 | $5,462 | $186,620 | $0 | $186,620 |
| 2024 | $5,248 | $186,620 | $0 | $186,620 |
| 2023 | $4,835 | $186,620 | $0 | $186,620 |
| 2022 | $4,828 | $186,620 | $0 | $186,620 |
| 2021 | $5,230 | $178,300 | $0 | $178,300 |
| 2020 | $5,230 | $178,300 | $0 | $178,300 |
| 2019 | $5,230 | $178,300 | $0 | $178,300 |
| 2018 | $5,230 | $178,300 | $0 | $178,300 |
| 2017 | $5,149 | $178,300 | $0 | $178,300 |
| 2016 | $5,112 | $186,300 | $0 | $186,300 |
| 2015 | $5,054 | $186,300 | $0 | $186,300 |
| 2014 | $5,054 | $186,300 | $0 | $186,300 |
Source: Public Records
Map
Nearby Homes