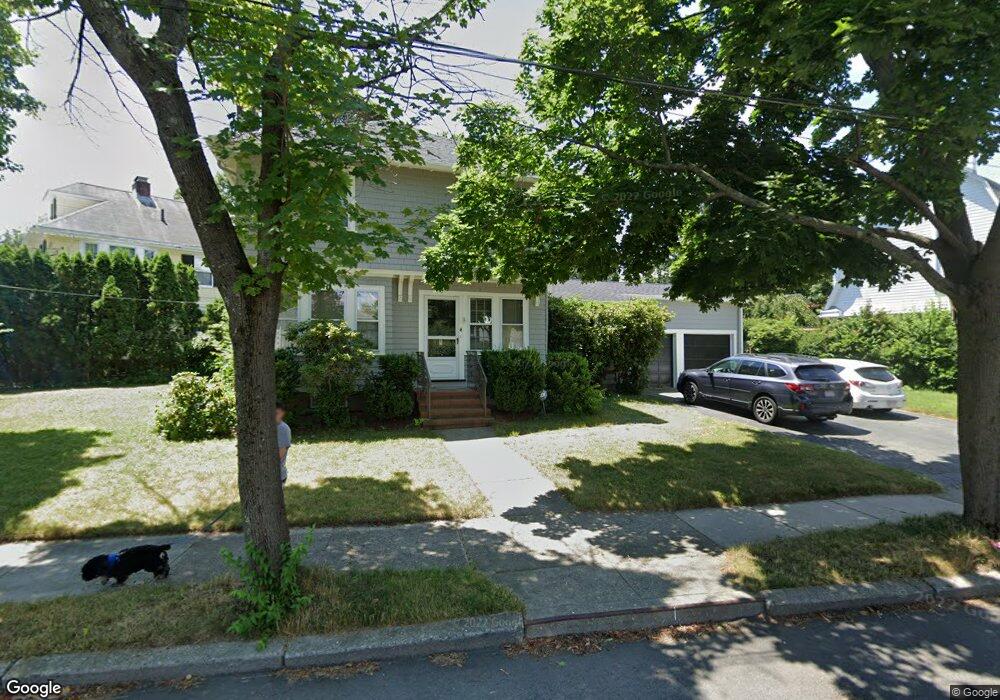
4 Durant St Newton, MA 02458
Newton Corner NeighborhoodEstimated Value: $1,280,000 - $1,535,000
4
Beds
2
Baths
1,850
Sq Ft
$757/Sq Ft
Est. Value
About This Home
This home is located at 4 Durant St, Newton, MA 02458 and is currently estimated at $1,401,086, approximately $757 per square foot. 4 Durant St is a home located in Middlesex County with nearby schools including Underwood Elementary School, Bigelow Middle School, and Newton North High School.
Ownership History
Date
Name
Owned For
Owner Type
Purchase Details
Closed on
Jan 12, 2007
Sold by
Steen Harold A and Steen Rhoda M
Bought by
Chan David and Louise Rosanna
Current Estimated Value
Home Financials for this Owner
Home Financials are based on the most recent Mortgage that was taken out on this home.
Original Mortgage
$532,400
Outstanding Balance
$331,915
Interest Rate
7%
Mortgage Type
Purchase Money Mortgage
Estimated Equity
$1,069,171
Create a Home Valuation Report for This Property
The Home Valuation Report is an in-depth analysis detailing your home's value as well as a comparison with similar homes in the area
Home Values in the Area
Average Home Value in this Area
Purchase History
| Date | Buyer | Sale Price | Title Company |
|---|---|---|---|
| Chan David | $665,500 | -- |
Source: Public Records
Mortgage History
| Date | Status | Borrower | Loan Amount |
|---|---|---|---|
| Open | Chan David | $532,400 |
Source: Public Records
Tax History
| Year | Tax Paid | Tax Assessment Tax Assessment Total Assessment is a certain percentage of the fair market value that is determined by local assessors to be the total taxable value of land and additions on the property. | Land | Improvement |
|---|---|---|---|---|
| 2025 | $10,917 | $1,114,000 | $1,012,000 | $102,000 |
| 2024 | $10,556 | $1,081,600 | $982,500 | $99,100 |
| 2023 | $10,049 | $987,100 | $750,200 | $236,900 |
| 2022 | $9,615 | $914,000 | $694,600 | $219,400 |
| 2021 | $9,278 | $862,300 | $655,300 | $207,000 |
| 2020 | $9,002 | $862,300 | $655,300 | $207,000 |
| 2019 | $8,749 | $837,200 | $636,200 | $201,000 |
| 2018 | $8,356 | $772,300 | $575,100 | $197,200 |
| 2017 | $8,102 | $728,600 | $542,500 | $186,100 |
| 2016 | $7,749 | $680,900 | $507,000 | $173,900 |
| 2015 | $7,389 | $636,400 | $473,800 | $162,600 |
Source: Public Records
Map
Nearby Homes
- 123 Park St
- 106 Farlow Rd
- 143 Tremont St Unit A
- 70 Washington St Unit 70
- 68 Vernon St
- 99 Tremont St Unit 206
- 99 Tremont St Unit 105
- 180 Hunnewell Ave Unit 180
- 180 Hunnewell Ave Unit A
- 548 Centre St Unit 5
- 65-67 Saint James Cir
- 9 Baldwin St Unit 15C
- 642 Centre St
- 35 George St Unit 35
- 37 George St Unit 37
- 33 George St Unit 33
- 4 Remick Terrace
- 23 Orchard St Unit 23
- 69 Presentation Rd
- 12 Richardson St Unit 14
- 77 Pembroke St
- 12 Durant St
- 79 Pembroke St
- 61 Pembroke St
- 7 Durant St
- 18 Durant St
- 15 Blackstone Terrace
- 11 Durant St
- 68 Pembroke St
- 55 Pembroke St
- 75 Nonantum St
- 75 Nonantum St Unit 4
- 60 Pembroke St
- 9 Blackstone Terrace
- 83 Pembroke St
- 148 Waverley Ave
- 81 Nonantum St
- 140 Waverley Ave
- 134 Waverley Ave
- 51 Pembroke St