Estimated Value: $67,000 - $217,000
7
Beds
2
Baths
1,598
Sq Ft
$97/Sq Ft
Est. Value
About This Home
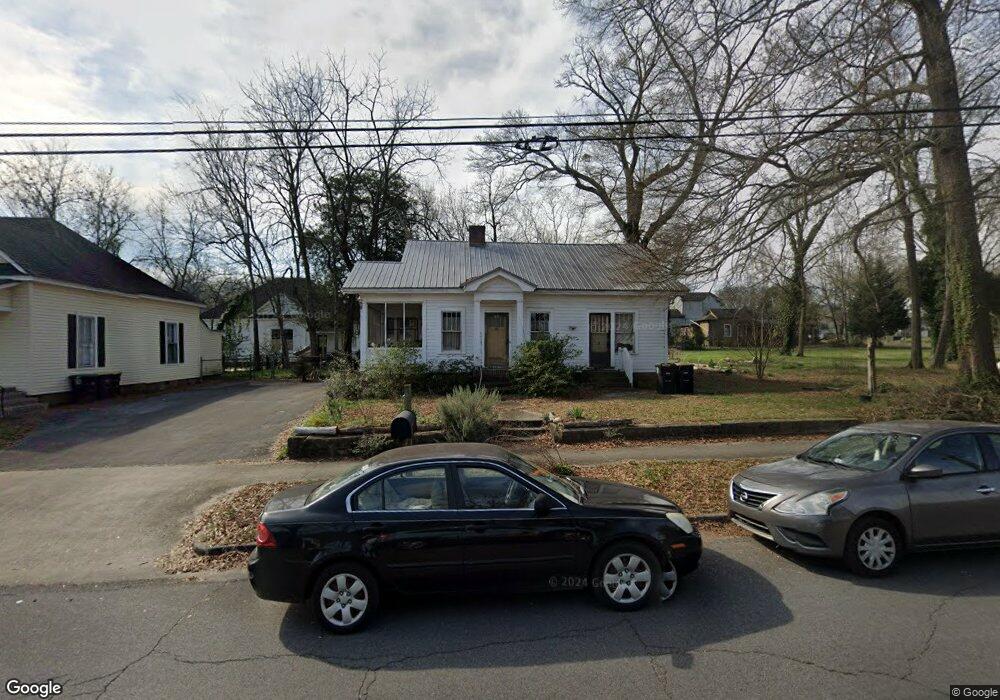
This home is located at 4 E 8th St SW, Rome, GA 30161 and is currently estimated at $154,358, approximately $96 per square foot. 4 E 8th St SW is a home located in Floyd County with nearby schools including Rome High School, St. Mary School, and Darlington School.
Ownership History
Date
Name
Owned For
Owner Type
Purchase Details
Closed on
Apr 22, 2024
Sold by
M T Ballenger Estate
Bought by
Jones Cameron Sterling
Current Estimated Value
Purchase Details
Closed on
May 20, 2003
Sold by
Duvall Lewis F
Bought by
Ballenger Ballenger H and Ballenger M
Purchase Details
Closed on
Feb 2, 1998
Sold by
Parnell James G and Parnell Betty S
Bought by
Duvall Lewis F
Purchase Details
Closed on
Oct 31, 1986
Sold by
Robbins James A
Bought by
Parnell James G and Parnell Betty S
Purchase Details
Closed on
Apr 13, 1983
Sold by
Hall Kathryn
Bought by
Robbins James A
Purchase Details
Closed on
May 29, 1979
Sold by
Sisson Mrs Raymoth M Self Life Int N/O A
Bought by
Hall Kathryn
Purchase Details
Closed on
Jun 8, 1966
Sold by
Self R M Mrs
Bought by
Sisson Mrs Raymoth M Self Life Int N/O A
Purchase Details
Closed on
Jan 2, 1901
Sold by
Mckenzie Alice Mrs
Bought by
Self R M Mrs
Purchase Details
Closed on
Jan 1, 1901
Bought by
Mckenzie Alice Mrs
Create a Home Valuation Report for This Property
The Home Valuation Report is an in-depth analysis detailing your home's value as well as a comparison with similar homes in the area
Home Values in the Area
Average Home Value in this Area
Purchase History
| Date | Buyer | Sale Price | Title Company |
|---|---|---|---|
| Jones Cameron Sterling | $60,000 | -- | |
| Ballenger Ballenger H | $60,000 | -- | |
| Duvall Lewis F | $52,000 | -- | |
| Parnell James G | $38,500 | -- | |
| Robbins James A | $33,000 | -- | |
| Hall Kathryn | $25,500 | -- | |
| Sisson Mrs Raymoth M Self Life Int N/O A | $4,400 | -- | |
| Self R M Mrs | -- | -- | |
| Mckenzie Alice Mrs | -- | -- |
Source: Public Records
Tax History
| Year | Tax Paid | Tax Assessment Tax Assessment Total Assessment is a certain percentage of the fair market value that is determined by local assessors to be the total taxable value of land and additions on the property. | Land | Improvement |
|---|---|---|---|---|
| 2025 | $2,410 | $67,423 | $4,840 | $62,583 |
| 2024 | $2,410 | $61,018 | $4,400 | $56,618 |
| 2023 | $2,161 | $51,603 | $4,000 | $47,603 |
| 2022 | $1,536 | $42,104 | $3,200 | $38,904 |
| 2021 | $463 | $34,602 | $3,200 | $31,402 |
| 2020 | $470 | $31,990 | $2,500 | $29,490 |
| 2019 | $462 | $30,077 | $2,500 | $27,577 |
| 2018 | $462 | $26,769 | $2,500 | $24,269 |
| 2017 | $462 | $25,732 | $2,500 | $23,232 |
| 2016 | $931 | $25,067 | $2,480 | $22,587 |
| 2015 | $879 | $25,067 | $2,480 | $22,587 |
| 2014 | $879 | $25,067 | $2,480 | $22,587 |
Source: Public Records
Map
Nearby Homes
- 801 Maple Ave SW
- 2 Coral Ave SW
- 9 Eastridge Ct SW
- 209 Moultrie Ln SE
- 803/805 Maple Ave SW
- 803/80 Maple Ave SW
- 1 E 11th St SW
- 166 E 11th St SW
- 162 E 11th St SE
- 31 Notasulga Dr SW
- 168 E 11th St SE
- 164 E 11th St SE
- 170 E 11th St SW
- 1011 Walnut Ave SW
- 416 E 9th St SE
- 415 E 10th St SE
- 419 E 13th St SW
- 320 E 3rd Ave
- 307 E 11th St SE
- 525 E 14th St SW
- 800 Darlington Way SW
- 6 E 8th St SW
- 802 Darlington Way SW
- 803 Maple Ave SW
- 805 Maple Ave SW
- 5 E 8th St SW
- 804 Darlington Way SW
- 7 E 8th St SW
- 807 Maple Ave SW
- 808 Darlington Way SW
- 809 Maple Ave SW
- 810 Darlington Way SW
- 714 E 2nd Ave
- 700 Maple Ave SE
- 716 E 2nd Ave SW
- 804 Maple Ave SW
- 802 Maple Ave SW
- 813 Maple Ave SW
- 704 E 2nd Ave SW
- 816 Darlington Way SW
Your Personal Tour Guide
Ask me questions while you tour the home.