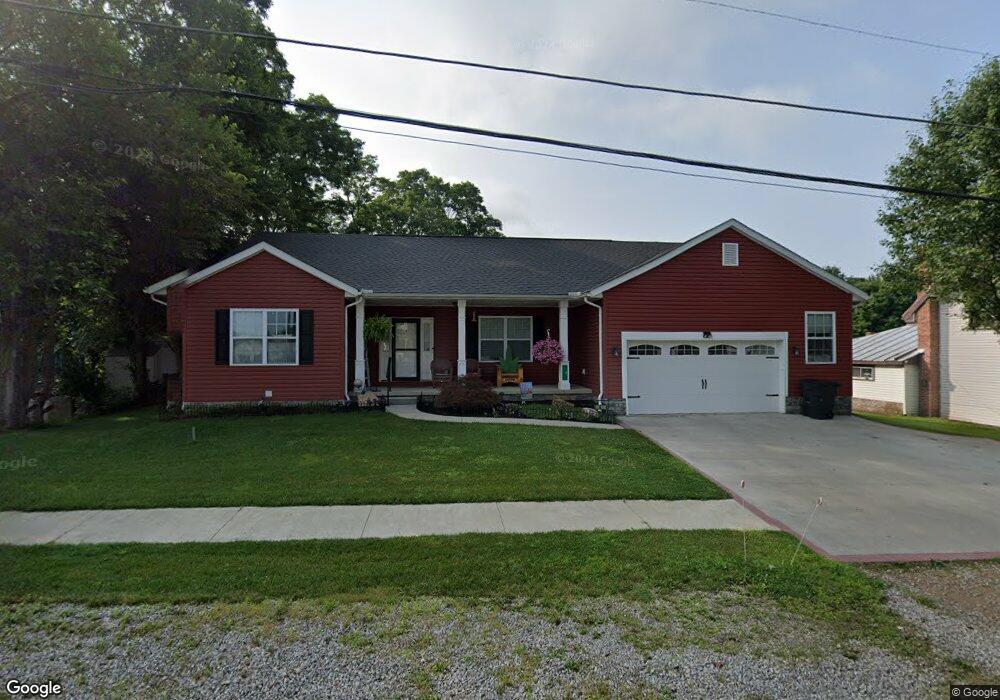
4 E Main St Sparta, OH 43350
Estimated Value: $240,000 - $334,000
3
Beds
2
Baths
1,612
Sq Ft
$183/Sq Ft
Est. Value
About This Home
This home is located at 4 E Main St, Sparta, OH 43350 and is currently estimated at $295,587, approximately $183 per square foot. 4 E Main St is a home with nearby schools including Highland Elementary School, Highland Middle School, and Highland High School.
Ownership History
Date
Name
Owned For
Owner Type
Purchase Details
Closed on
May 8, 2018
Sold by
Price Mary and Price Jerry
Bought by
Price Kenneth E and Price Kerry
Current Estimated Value
Purchase Details
Closed on
Jun 27, 2016
Sold by
Price Mary
Bought by
Mary Price and Eugene Price Kenneth
Purchase Details
Closed on
Mar 22, 2013
Sold by
Price Mary
Bought by
Price Marshal Maynard and Price Tina
Purchase Details
Closed on
Oct 4, 2004
Sold by
Price Jerry L
Bought by
Price Marshall Maynard
Purchase Details
Closed on
May 27, 2004
Sold by
Vandyke Ben
Bought by
Price Jerry L
Purchase Details
Closed on
Nov 12, 1992
Bought by
Vandyke Ben
Create a Home Valuation Report for This Property
The Home Valuation Report is an in-depth analysis detailing your home's value as well as a comparison with similar homes in the area
Purchase History
| Date | Buyer | Sale Price | Title Company |
|---|---|---|---|
| Price Kenneth E | -- | -- | |
| Mary Price | -- | -- | |
| Price Marshal Maynard | -- | -- | |
| Price Marshall Maynard | -- | -- | |
| Price Jerry L | -- | -- | |
| Vandyke Ben | -- | -- |
Source: Public Records
Tax History Compared to Growth
Tax History
| Year | Tax Paid | Tax Assessment Tax Assessment Total Assessment is a certain percentage of the fair market value that is determined by local assessors to be the total taxable value of land and additions on the property. | Land | Improvement |
|---|---|---|---|---|
| 2024 | $3,930 | $90,660 | $4,590 | $86,070 |
| 2023 | $3,930 | $90,660 | $4,590 | $86,070 |
| 2022 | $3,596 | $72,730 | $5,460 | $67,270 |
| 2021 | $3,565 | $72,730 | $5,460 | $67,270 |
| 2020 | $3,532 | $72,730 | $5,460 | $67,270 |
| 2019 | $3,063 | $61,120 | $4,590 | $56,530 |
| 2018 | $159 | $3,220 | $3,220 | $0 |
| 2017 | $161 | $3,260 | $3,260 | $0 |
| 2016 | $191 | $4,060 | $4,060 | $0 |
| 2015 | $181 | $4,060 | $4,060 | $0 |
| 2014 | $183 | $4,060 | $4,060 | $0 |
| 2013 | $182 | $4,060 | $4,060 | $0 |
Source: Public Records
Map
Nearby Homes
- 0 State Route 656 Unit 225021725
- 6950 Township Road 197
- 7046 Township Road 195
- 1129 Township Road 198
- 0003 County Road 19
- 0002 County Road 19
- 682 County Road 204
- 6159 County Road 191
- 1163 1/2 Township Road 198
- 244 Ohio 314
- 6054 Township Road 183
- 2486 Township Road 181
- 0 Ball Rd
- 5250 Township Road 21
- 5341 Township Road 191
- 3020 Chesterville Sparta Rd
- 6288 County Road 25
- 0 County Road 170 Unit 20850667
- 0 County Road 170 Unit 225006379
- 0 County Road 170 Unit 20850668