Estimated Value: $1,693,000 - $1,918,000
4
Beds
4
Baths
2,460
Sq Ft
$724/Sq Ft
Est. Value
About This Home
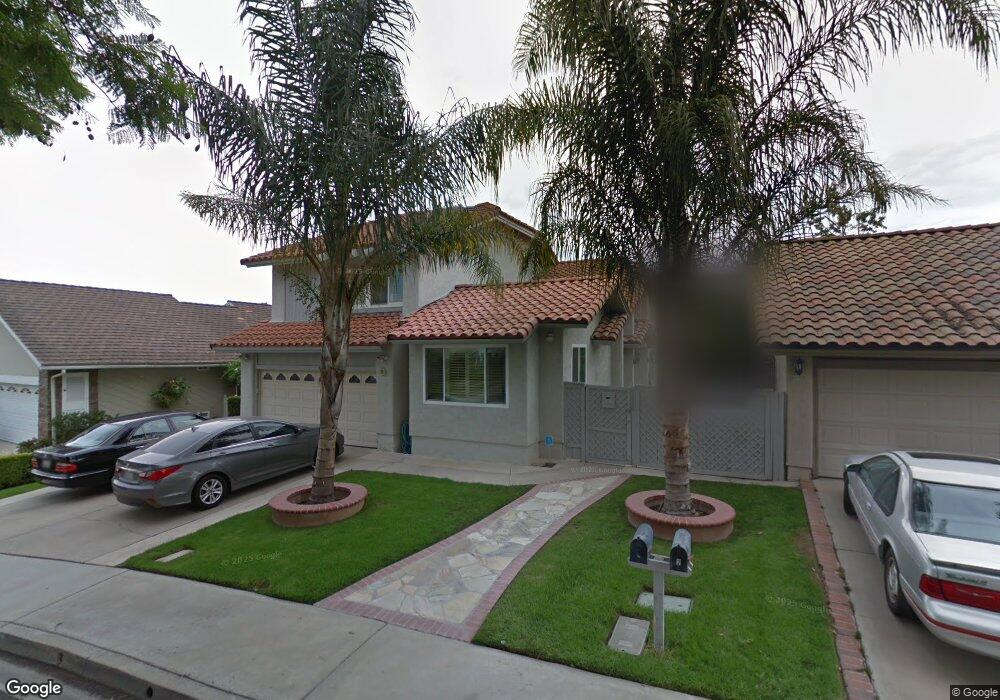
This home is located at 4 Eden, Irvine, CA 92620 and is currently estimated at $1,782,030, approximately $724 per square foot. 4 Eden is a home located in Orange County with nearby schools including Santiago Hills Elementary School, Sierra Vista Middle School, and Northwood High School.
Ownership History
Date
Name
Owned For
Owner Type
Purchase Details
Closed on
Jan 31, 2026
Sold by
Abbasi Paniz and Abbasi Parsa
Bought by
Ghelechi Family Trust and Ghelechi
Current Estimated Value
Purchase Details
Closed on
Oct 31, 2025
Sold by
Abbasi Michael and Ghelechi Neda
Bought by
Abbasi Paniz and Abbasi Parsa
Purchase Details
Closed on
May 5, 2017
Sold by
Abbasi Michael
Bought by
Abbasi Michael
Home Financials for this Owner
Home Financials are based on the most recent Mortgage that was taken out on this home.
Original Mortgage
$358,000
Interest Rate
3.87%
Mortgage Type
Adjustable Rate Mortgage/ARM
Purchase Details
Closed on
Mar 9, 2007
Sold by
Ghelechi Neda
Bought by
Abbasi Michael
Home Financials for this Owner
Home Financials are based on the most recent Mortgage that was taken out on this home.
Original Mortgage
$250,000
Interest Rate
6.29%
Mortgage Type
New Conventional
Purchase Details
Closed on
Nov 28, 2006
Sold by
Abbasi Michael M
Bought by
Abbasi Michael
Purchase Details
Closed on
Nov 4, 2006
Sold by
Abbasi Ahmad and Abbasi Michael
Bought by
Abbasi Michael
Purchase Details
Closed on
Oct 12, 2006
Sold by
Ghelichi Neda
Bought by
Abbasi Michael
Purchase Details
Closed on
Dec 5, 2003
Sold by
Abbasi Michael
Bought by
Abbasi Michael and The Pasha Irrevocable Trust
Home Financials for this Owner
Home Financials are based on the most recent Mortgage that was taken out on this home.
Original Mortgage
$387,000
Interest Rate
5.92%
Mortgage Type
Stand Alone First
Purchase Details
Closed on
Nov 12, 1999
Sold by
Abbasi Michael M
Bought by
Abbasi Ahmad and Abbasi Michael
Home Financials for this Owner
Home Financials are based on the most recent Mortgage that was taken out on this home.
Original Mortgage
$269,000
Interest Rate
7.68%
Mortgage Type
Stand Alone First
Purchase Details
Closed on
Oct 11, 1999
Sold by
Nelson Biff B and Nelson Candy Lee
Bought by
Abbasi Michael M
Home Financials for this Owner
Home Financials are based on the most recent Mortgage that was taken out on this home.
Original Mortgage
$269,000
Interest Rate
7.68%
Mortgage Type
Stand Alone First
Purchase Details
Closed on
Oct 8, 1998
Sold by
Yin Chen Chao
Bought by
Nelson Biff B and Nelson Candy Lee
Home Financials for this Owner
Home Financials are based on the most recent Mortgage that was taken out on this home.
Original Mortgage
$261,600
Interest Rate
6.61%
Create a Home Valuation Report for This Property
The Home Valuation Report is an in-depth analysis detailing your home's value as well as a comparison with similar homes in the area
Home Values in the Area
Average Home Value in this Area
Purchase History
| Date | Buyer | Sale Price | Title Company |
|---|---|---|---|
| Ghelechi Family Trust | -- | None Listed On Document | |
| Abbasi Paniz | -- | None Listed On Document | |
| Abbasi Michael | -- | First American Title Company | |
| Abbasi Michael | -- | First American Title Ins | |
| Abbasi Michael | -- | None Available | |
| Abbasi Michael | -- | First American Title Co | |
| Abbasi Michael | -- | First American Title Co | |
| Abbasi Michael | -- | -- | |
| Abbasi Ahmad | -- | Old Republic Title Company | |
| Abbasi Michael M | $336,500 | Old Republic Title Company | |
| Nelson Biff B | $327,000 | Commonwealth Land Title |
Source: Public Records
Mortgage History
| Date | Status | Borrower | Loan Amount |
|---|---|---|---|
| Previous Owner | Abbasi Michael | $358,000 | |
| Previous Owner | Abbasi Michael | $250,000 | |
| Previous Owner | Abbasi Michael | $387,000 | |
| Previous Owner | Abbasi Michael M | $269,000 | |
| Previous Owner | Nelson Biff B | $261,600 |
Source: Public Records
Tax History
| Year | Tax Paid | Tax Assessment Tax Assessment Total Assessment is a certain percentage of the fair market value that is determined by local assessors to be the total taxable value of land and additions on the property. | Land | Improvement |
|---|---|---|---|---|
| 2025 | $5,984 | $568,106 | $287,026 | $281,080 |
| 2024 | $5,984 | $556,967 | $281,398 | $275,569 |
| 2023 | $5,830 | $546,047 | $275,881 | $270,166 |
| 2022 | $12,491 | $535,341 | $270,472 | $264,869 |
| 2021 | $5,514 | $524,845 | $265,169 | $259,676 |
| 2020 | $5,482 | $519,464 | $262,450 | $257,014 |
| 2019 | $5,360 | $509,279 | $257,304 | $251,975 |
| 2018 | $5,263 | $499,294 | $252,259 | $247,035 |
| 2017 | $5,226 | $489,504 | $247,312 | $242,192 |
| 2016 | $4,996 | $479,906 | $242,462 | $237,444 |
| 2015 | $4,868 | $472,698 | $238,820 | $233,878 |
| 2014 | $4,774 | $463,439 | $234,142 | $229,297 |
Source: Public Records
Map
Nearby Homes
Your Personal Tour Guide
Ask me questions while you tour the home.