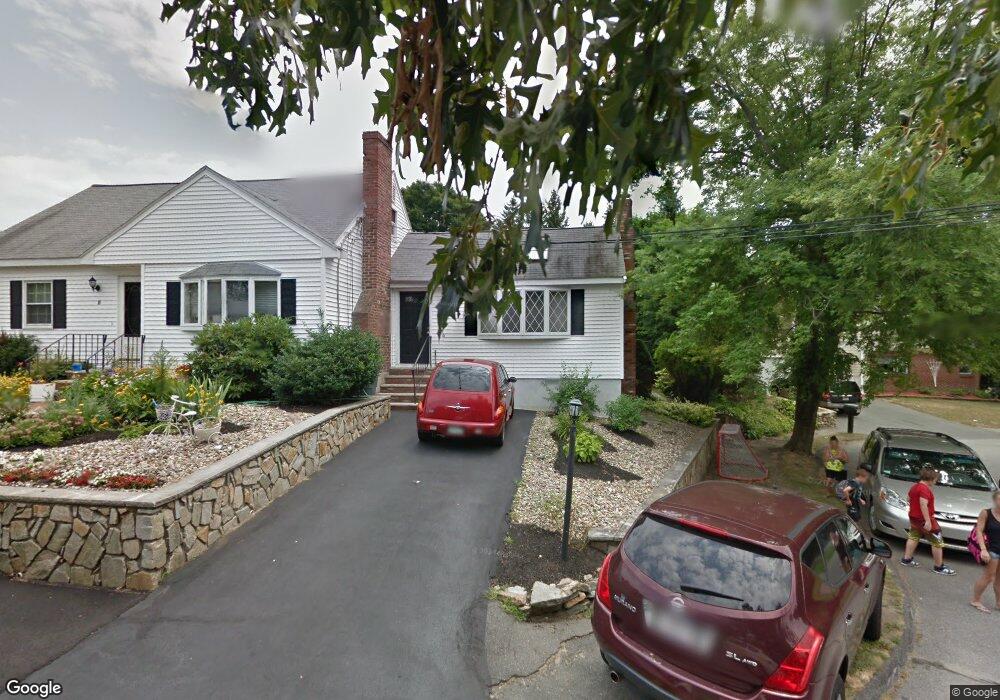
4 Elaine Rd Woburn, MA 01801
Mishawum NeighborhoodEstimated Value: $1,123,000 - $1,312,000
6
Beds
5
Baths
3,781
Sq Ft
$326/Sq Ft
Est. Value
About This Home
This home is located at 4 Elaine Rd, Woburn, MA 01801 and is currently estimated at $1,232,282, approximately $325 per square foot. 4 Elaine Rd is a home located in Middlesex County with nearby schools including Wyman Elementary School, John F. Kennedy Middle School, and Woburn High School.
Ownership History
Date
Name
Owned For
Owner Type
Purchase Details
Closed on
Sep 19, 2011
Sold by
Caliri Anthony J and Caliri Doreen
Bought by
Caliri Anthony J and Caliri Kimberley A
Current Estimated Value
Home Financials for this Owner
Home Financials are based on the most recent Mortgage that was taken out on this home.
Original Mortgage
$30,000
Outstanding Balance
$20,587
Interest Rate
4.38%
Mortgage Type
Purchase Money Mortgage
Estimated Equity
$1,211,695
Purchase Details
Closed on
Aug 8, 2011
Sold by
Caliri Anthony J and Caliri Doreen
Bought by
Caliri Anthony J and Caliri Kimberley A
Home Financials for this Owner
Home Financials are based on the most recent Mortgage that was taken out on this home.
Original Mortgage
$30,000
Outstanding Balance
$20,587
Interest Rate
4.38%
Mortgage Type
Purchase Money Mortgage
Estimated Equity
$1,211,695
Purchase Details
Closed on
Jun 28, 2007
Sold by
Caliri Anthony J and Caliri Anthony J
Bought by
Caliri Anthony J and Caliri Doreen
Purchase Details
Closed on
Jun 26, 1990
Sold by
Woolard Daniel R
Bought by
Caliri Anthony J
Create a Home Valuation Report for This Property
The Home Valuation Report is an in-depth analysis detailing your home's value as well as a comparison with similar homes in the area
Home Values in the Area
Average Home Value in this Area
Purchase History
| Date | Buyer | Sale Price | Title Company |
|---|---|---|---|
| Caliri Anthony J | -- | -- | |
| Caliri Anthony J | -- | -- | |
| Caliri Anthony J | -- | -- | |
| Caliri Anthony J | -- | -- | |
| Caliri Anthony J | -- | -- | |
| Caliri Anthony J | -- | -- | |
| Caliri Anthony J | -- | -- | |
| Caliri Anthony J | $218,250 | -- |
Source: Public Records
Mortgage History
| Date | Status | Borrower | Loan Amount |
|---|---|---|---|
| Open | Caliri Anthony J | $30,000 | |
| Closed | Caliri Anthony J | $30,000 |
Source: Public Records
Tax History Compared to Growth
Tax History
| Year | Tax Paid | Tax Assessment Tax Assessment Total Assessment is a certain percentage of the fair market value that is determined by local assessors to be the total taxable value of land and additions on the property. | Land | Improvement |
|---|---|---|---|---|
| 2025 | $9,823 | $1,150,200 | $370,000 | $780,200 |
| 2024 | $9,066 | $1,124,800 | $352,500 | $772,300 |
| 2023 | $8,753 | $1,006,100 | $320,400 | $685,700 |
| 2022 | $8,622 | $923,100 | $278,900 | $644,200 |
| 2021 | $8,103 | $868,500 | $265,700 | $602,800 |
| 2020 | $7,580 | $813,300 | $265,700 | $547,600 |
| 2019 | $7,630 | $803,200 | $253,100 | $550,100 |
| 2018 | $7,498 | $758,100 | $232,400 | $525,700 |
| 2017 | $7,023 | $706,500 | $221,400 | $485,100 |
| 2016 | $6,737 | $670,300 | $207,100 | $463,200 |
| 2015 | $6,531 | $642,200 | $193,600 | $448,600 |
| 2014 | $5,922 | $567,200 | $193,600 | $373,600 |
Source: Public Records
Map
Nearby Homes
- 52 Middle St
- 38 Middle St
- 0 Fryeburg Rd
- 3 Highet Ave
- 8 Clinton St
- 12 Mishawum Rd
- 74 Beach St Unit 6-12
- 74 Beach St Unit 3
- 6 Callahan Dr
- 602 Main St Unit 1
- 3 Hart St
- 166 Place Ln Unit 166
- 168 Place Ln
- 20 Barbara Cir
- 18 Hamilton Rd
- 14 Church Ave
- 14 Church Ave Unit 2
- 104 Forest Park Rd
- 37 1/2 Chestnut St
- 9 Wade Ave
- 8 Phillips St
- 6 Elaine Rd
- 6 Phillips St
- 6 Phillips St Unit R
- 1 Elaine Rd
- 6 Dorothy Dr
- 9 Fairview Terrace
- 3 Elaine Rd
- 9 Phillips St
- 9 Phillips St Unit 1
- 7 Phillips St
- 12 Phillips St
- 5 Elaine Rd
- 4 Phillips St
- 10 Fairview Terrace
- 11 Phillips St
- 7 Fairview Terrace
- 5 Phillips St
- 8 Dorothy Dr
- 48 Middle St