Estimated Value: $194,000 - $232,137
Studio
--
Bath
1,127
Sq Ft
$189/Sq Ft
Est. Value
About This Home
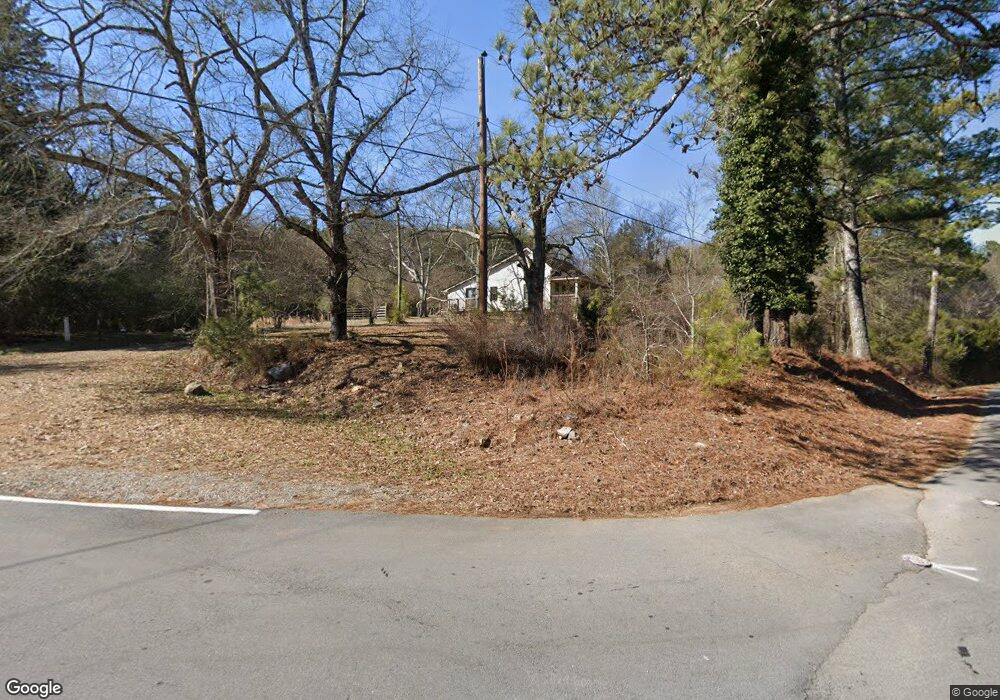
This home is located at 4 Ellis Rd SE, Rome, GA 30161 and is currently estimated at $212,534, approximately $188 per square foot. 4 Ellis Rd SE is a home with nearby schools including Pepperell Middle School and Pepperell High School.
Ownership History
Date
Name
Owned For
Owner Type
Purchase Details
Closed on
Feb 18, 2016
Sold by
Stancil Terry W
Bought by
Alford Gary Jerone
Current Estimated Value
Home Financials for this Owner
Home Financials are based on the most recent Mortgage that was taken out on this home.
Original Mortgage
$79,500
Interest Rate
3.81%
Mortgage Type
New Conventional
Purchase Details
Closed on
Dec 21, 2012
Sold by
White Billy Joe
Bought by
Stancil Terry W and Stancil Teri E
Purchase Details
Closed on
Oct 17, 2005
Sold by
Lloyd Robert M
Bought by
White B J and White Jo Ann
Purchase Details
Closed on
Sep 29, 2005
Sold by
Cottle Amy Lloyd
Bought by
Lloyd Robert M
Purchase Details
Closed on
Feb 18, 1997
Bought by
P and R
Purchase Details
Closed on
Aug 21, 1985
Sold by
Ellis James H
Bought by
Lloyd Frances
Purchase Details
Closed on
Jan 2, 1939
Sold by
Ellis J Howard
Bought by
Ellis James H
Purchase Details
Closed on
Jan 1, 1939
Bought by
Ellis J Howard
Create a Home Valuation Report for This Property
The Home Valuation Report is an in-depth analysis detailing your home's value as well as a comparison with similar homes in the area
Home Values in the Area
Average Home Value in this Area
Purchase History
We collect this data history from publicly available records. To have your information removed, we recommend requesting removal directly through your county’s website.
| Date | Buyer | Sale Price | Title Company |
|---|---|---|---|
| Alford Gary Jerone | $85,500 | -- | |
| Stancil Terry W | -- | -- | |
| White B J | $145,000 | -- | |
| Bryant Larry D | $16,440 | -- | |
| Lloyd Robert M | -- | -- | |
| Lloyd Robert M | -- | -- | |
| P | -- | -- | |
| Lloyd Frances | -- | -- | |
| Ellis James H | -- | -- | |
| Ellis J Howard | -- | -- |
Source: Public Records
Mortgage History
We collect this data history from publicly available records. To have your information removed, we recommend requesting removal directly through your county’s website.
| Date | Status | Borrower | Loan Amount |
|---|---|---|---|
| Closed | Alford Gary Jerone | $79,500 |
Source: Public Records
Tax History
| Year | Tax Paid | Tax Assessment Tax Assessment Total Assessment is a certain percentage of the fair market value that is determined by local assessors to be the total taxable value of land and additions on the property. | Land | Improvement |
|---|---|---|---|---|
| 2025 | $937 | $92,805 | $71,735 | $21,070 |
| 2024 | $937 | $76,731 | $57,388 | $19,343 |
| 2023 | $842 | $76,065 | $57,388 | $18,677 |
| 2022 | $763 | $60,739 | $45,104 | $15,635 |
| 2021 | $680 | $45,323 | $32,249 | $13,074 |
| 2020 | $664 | $41,268 | $28,560 | $12,708 |
| 2019 | $635 | $40,844 | $28,560 | $12,284 |
| 2018 | $609 | $36,572 | $24,867 | $11,705 |
| 2017 | $598 | $36,389 | $24,867 | $11,522 |
| 2016 | $599 | $36,372 | $24,840 | $11,532 |
| 2015 | $451 | $36,372 | $24,840 | $11,532 |
| 2014 | $451 | $36,372 | $24,840 | $11,532 |
Source: Public Records
Map
Nearby Homes
- 300 Ellis Rd SE
- 113 Miami Dr SE
- 189 Boyd Valley Rd SE
- 172 Sweet Water Ln SE
- 1278 Chulio Rd SE
- 122 Tugaloo Cir SE
- 119 Tugaloo Cir SE
- 121 Tugaloo Cir
- 5 Tugaloo Cir SE
- 30 Rushden Way SE
- 28 Rushden Way SE
- 131 Hine Rd SE
- 2 Rushden Way SE
- 7 Shirley Ln SE
- 3 Rushden Way SE
- 14 Jewell Dr SE
- 15 Jewell Dr SE Unit 3
- 13 Jewell Dr SE
- 205 Nichols Rd SE
- 2700 Chulio Rd SE
- 0 Ellis Rd SE Unit 7 8223319
- 0 Ellis Rd SE Unit 5 8223292
- 0 Ellis Rd SE Unit 10084392
- 5 Ellis Rd SE
- 7 Ellis Rd SE
- 249 Ellis Rd SE
- 26 Ellis Rd SE
- 1289 Mathis Rd SE
- 141 Ellis Rd SE
- 1107 Mathis Rd SE
- 1111 Mathis Rd SE
- 1085 Mathis Rd SE
- 1085 Mathis Rd SE
- 1342 Mathis Rd SE
- 1084 Mathis Rd SE
- 142 Ellis Rd SE
- 213 Ellis Rd SE
- 1410 Mathis Rd SE
- 1056 Mathis Rd SE
- 1056 Mathis Rd SE
Your Personal Tour Guide
Ask me questions while you tour the home.