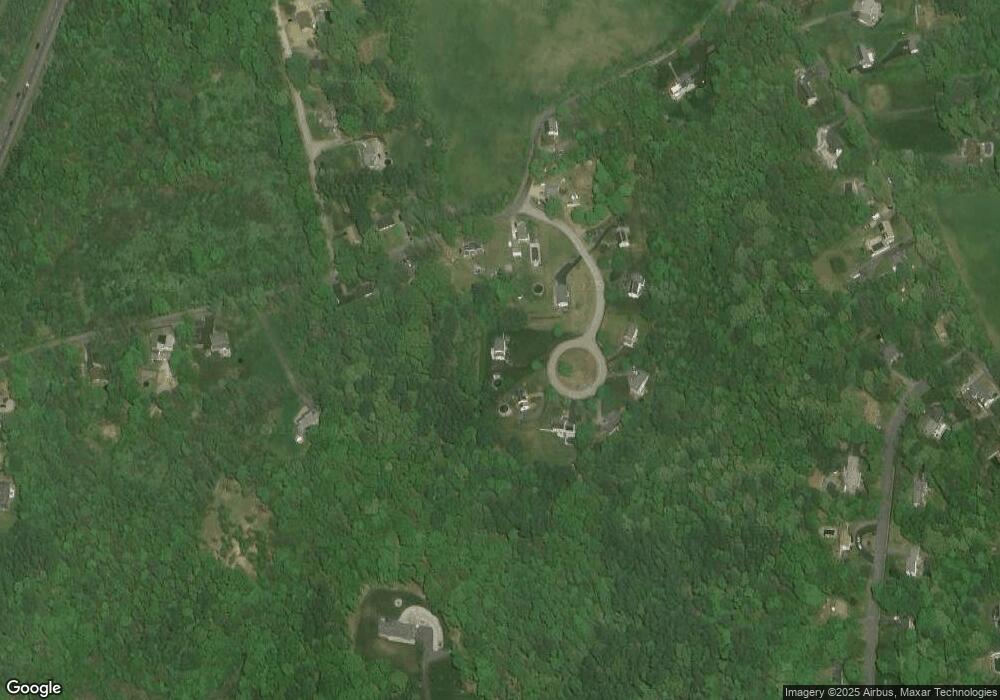
4 Esther Cir Oxford, MA 01540
Estimated Value: $543,476 - $649,000
3
Beds
3
Baths
2,208
Sq Ft
$276/Sq Ft
Est. Value
About This Home
This home is located at 4 Esther Cir, Oxford, MA 01540 and is currently estimated at $610,369, approximately $276 per square foot. 4 Esther Cir is a home located in Worcester County with nearby schools including Alfred M Chaffee, Oxford High School, and Clara Barton Elementary School.
Ownership History
Date
Name
Owned For
Owner Type
Purchase Details
Closed on
Oct 7, 2011
Sold by
David J Sullivan Ret and Sullivan David J
Bought by
Sullivan David J and Sullivan Deborah A
Current Estimated Value
Purchase Details
Closed on
Sep 26, 2003
Sold by
Wood Gary R and Wood Susan G
Bought by
Sullivan David J and Sullivan Deborah A
Home Financials for this Owner
Home Financials are based on the most recent Mortgage that was taken out on this home.
Original Mortgage
$156,920
Interest Rate
6.29%
Mortgage Type
Purchase Money Mortgage
Purchase Details
Closed on
Nov 9, 1999
Sold by
Mildred Rt and Gordon Candace M
Bought by
Wood Gary R and Wood Susan G
Home Financials for this Owner
Home Financials are based on the most recent Mortgage that was taken out on this home.
Original Mortgage
$196,900
Interest Rate
7.73%
Mortgage Type
Purchase Money Mortgage
Create a Home Valuation Report for This Property
The Home Valuation Report is an in-depth analysis detailing your home's value as well as a comparison with similar homes in the area
Home Values in the Area
Average Home Value in this Area
Purchase History
| Date | Buyer | Sale Price | Title Company |
|---|---|---|---|
| Sullivan David J | -- | -- | |
| Sullivan David J | $329,900 | -- | |
| Wood Gary R | $211,956 | -- |
Source: Public Records
Mortgage History
| Date | Status | Borrower | Loan Amount |
|---|---|---|---|
| Previous Owner | Sullivan David J | $156,920 | |
| Previous Owner | Wood Gary R | $196,900 |
Source: Public Records
Tax History Compared to Growth
Tax History
| Year | Tax Paid | Tax Assessment Tax Assessment Total Assessment is a certain percentage of the fair market value that is determined by local assessors to be the total taxable value of land and additions on the property. | Land | Improvement |
|---|---|---|---|---|
| 2025 | $63 | $501,100 | $126,000 | $375,100 |
| 2024 | $6,171 | $457,800 | $116,500 | $341,300 |
| 2023 | $5,727 | $419,900 | $111,500 | $308,400 |
| 2022 | $5,751 | $355,900 | $86,400 | $269,500 |
| 2021 | $5,549 | $335,700 | $82,000 | $253,700 |
| 2020 | $5,361 | $321,800 | $82,000 | $239,800 |
| 2019 | $5,269 | $309,400 | $82,000 | $227,400 |
| 2018 | $5,003 | $289,700 | $82,000 | $207,700 |
| 2017 | $4,945 | $293,500 | $78,600 | $214,900 |
| 2016 | $4,969 | $293,500 | $78,600 | $214,900 |
| 2015 | $4,634 | $293,500 | $78,600 | $214,900 |
| 2014 | $4,520 | $301,300 | $76,600 | $224,700 |
Source: Public Records
Map
Nearby Homes