4 Evergreen Dr North Andover, MA 01845
Estimated Value: $941,000 - $1,066,000
3
Beds
4
Baths
1,800
Sq Ft
$552/Sq Ft
Est. Value
About This Home
This home is located at 4 Evergreen Dr, North Andover, MA 01845 and is currently estimated at $992,760, approximately $551 per square foot. 4 Evergreen Dr is a home located in Essex County with nearby schools including Franklin Elementary School, North Andover Middle School, and North Andover High School.
Ownership History
Date
Name
Owned For
Owner Type
Purchase Details
Closed on
Dec 9, 2020
Sold by
Linda F Ryan Ret and Ryan
Bought by
4 Evergreen Drive Rt and Ryan
Current Estimated Value
Purchase Details
Closed on
Dec 24, 2009
Sold by
Sarcia Frank A and Sarcia Eleanor M
Bought by
Shrivastava Sanjiv K and Shrivastava Mala
Home Financials for this Owner
Home Financials are based on the most recent Mortgage that was taken out on this home.
Original Mortgage
$380,000
Interest Rate
4.92%
Mortgage Type
Purchase Money Mortgage
Create a Home Valuation Report for This Property
The Home Valuation Report is an in-depth analysis detailing your home's value as well as a comparison with similar homes in the area
Home Values in the Area
Average Home Value in this Area
Purchase History
| Date | Buyer | Sale Price | Title Company |
|---|---|---|---|
| 4 Evergreen Drive Rt | -- | None Available | |
| 4 Evergreen Drive Rt | -- | None Available | |
| Shrivastava Sanjiv K | $475,000 | -- | |
| Shrivastava Sanjiv K | $475,000 | -- |
Source: Public Records
Mortgage History
| Date | Status | Borrower | Loan Amount |
|---|---|---|---|
| Previous Owner | Shrivastava Sanjiv K | $380,000 | |
| Previous Owner | Shrivastava Sanjiv K | $150,000 |
Source: Public Records
Tax History Compared to Growth
Tax History
| Year | Tax Paid | Tax Assessment Tax Assessment Total Assessment is a certain percentage of the fair market value that is determined by local assessors to be the total taxable value of land and additions on the property. | Land | Improvement |
|---|---|---|---|---|
| 2025 | $10,146 | $901,100 | $443,200 | $457,900 |
| 2024 | $9,483 | $855,100 | $421,400 | $433,700 |
| 2023 | $9,215 | $752,900 | $355,600 | $397,300 |
| 2022 | $9,211 | $680,800 | $325,100 | $355,700 |
| 2021 | $8,926 | $629,900 | $296,800 | $333,100 |
| 2020 | $8,461 | $615,800 | $296,800 | $319,000 |
| 2019 | $8,258 | $615,800 | $296,800 | $319,000 |
| 2018 | $8,948 | $615,800 | $296,800 | $319,000 |
| 2017 | $6,990 | $489,500 | $232,100 | $257,400 |
| 2016 | $6,640 | $465,300 | $230,800 | $234,500 |
| 2015 | $6,229 | $432,900 | $227,200 | $205,700 |
Source: Public Records
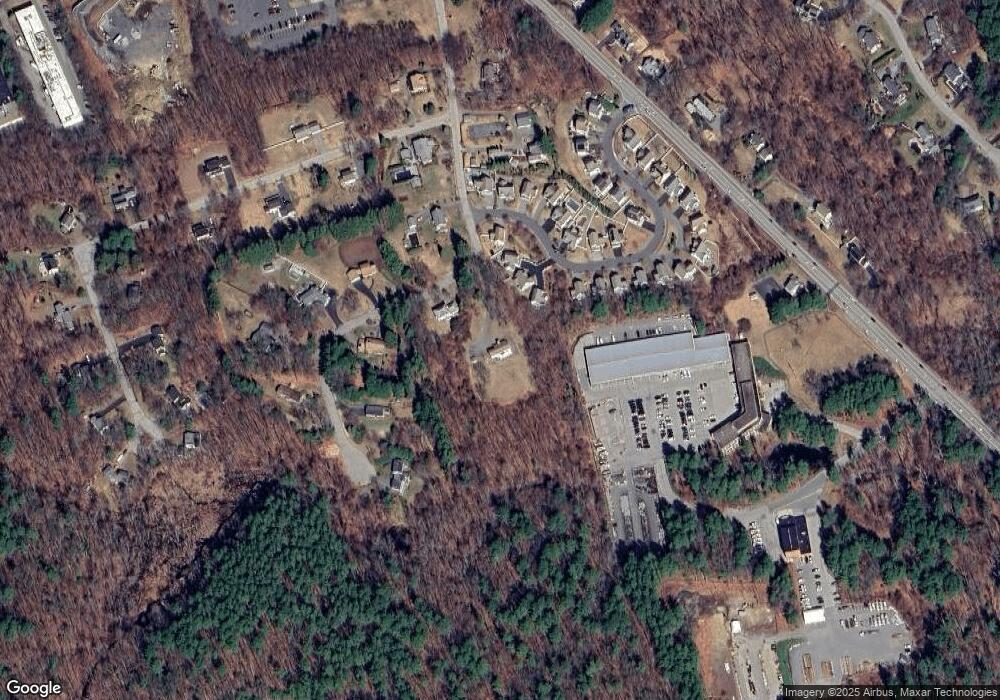
Map
Nearby Homes