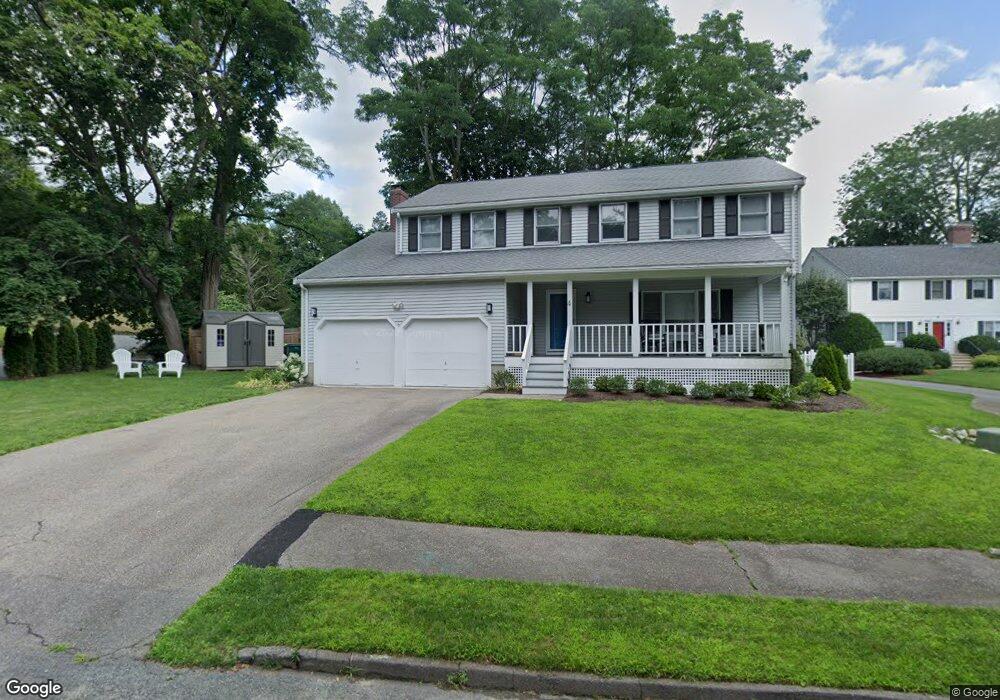
4 Farnham Cir Needham, MA 02492
Estimated Value: $1,323,000 - $1,688,000
4
Beds
4
Baths
1,036
Sq Ft
$1,480/Sq Ft
Est. Value
About This Home
This home is located at 4 Farnham Cir, Needham, MA 02492 and is currently estimated at $1,533,351, approximately $1,480 per square foot. 4 Farnham Cir is a home located in Norfolk County with nearby schools including Sunita L. Williams Elementary School, High Rock Middle School, and Pollard Middle School.
Ownership History
Date
Name
Owned For
Owner Type
Purchase Details
Closed on
Aug 31, 1998
Sold by
Leibowitz Hal J and Leibowitz Jill M
Bought by
Safran Linda F
Current Estimated Value
Home Financials for this Owner
Home Financials are based on the most recent Mortgage that was taken out on this home.
Original Mortgage
$175,000
Interest Rate
6.9%
Mortgage Type
Purchase Money Mortgage
Create a Home Valuation Report for This Property
The Home Valuation Report is an in-depth analysis detailing your home's value as well as a comparison with similar homes in the area
Home Values in the Area
Average Home Value in this Area
Purchase History
| Date | Buyer | Sale Price | Title Company |
|---|---|---|---|
| Safran Linda F | $445,000 | -- | |
| Safran Linda F | $445,000 | -- |
Source: Public Records
Mortgage History
| Date | Status | Borrower | Loan Amount |
|---|---|---|---|
| Open | Safran Linda F | $500,000 | |
| Closed | Safran Linda F | $175,000 |
Source: Public Records
Tax History Compared to Growth
Tax History
| Year | Tax Paid | Tax Assessment Tax Assessment Total Assessment is a certain percentage of the fair market value that is determined by local assessors to be the total taxable value of land and additions on the property. | Land | Improvement |
|---|---|---|---|---|
| 2025 | $13,778 | $1,299,800 | $797,100 | $502,700 |
| 2024 | $11,636 | $929,400 | $504,500 | $424,900 |
| 2023 | $11,713 | $898,200 | $504,500 | $393,700 |
| 2022 | $11,248 | $841,300 | $462,900 | $378,400 |
| 2021 | $10,962 | $841,300 | $462,900 | $378,400 |
| 2020 | $10,633 | $851,300 | $462,800 | $388,500 |
| 2019 | $9,976 | $805,200 | $420,700 | $384,500 |
| 2018 | $9,566 | $805,200 | $420,700 | $384,500 |
| 2017 | $9,005 | $757,400 | $420,700 | $336,700 |
| 2016 | $8,783 | $761,100 | $420,700 | $340,400 |
| 2015 | $8,593 | $761,100 | $420,700 | $340,400 |
| 2014 | $8,134 | $698,800 | $365,800 | $333,000 |
Source: Public Records
Map
Nearby Homes
- 29 Tolman St
- 34 Pershing Rd
- 445 Hillside Ave
- 3 Crescent Rd
- 361 High Rock St
- 24 Deerfield Rd
- 71 School St
- 35 Andrea Cir
- 379 Hunnewell St Unit 379
- 381 Hunnewell St Unit 381
- 287 High Rock St
- 154 Warren St
- 403 Hunnewell St Unit 403
- 10 Fieldstone Way Unit 10
- 233 Warren St
- 400 Hunnewell St Unit 103
- 556 Webster St
- 132 Hillside Ave
- 12 Hill St
- 37 Carleton Dr
- 12 Farnham Cir
- 1038 Central Ave
- 8 Noyes St
- 16 Farnham Cir
- 20 Farnham Cir
- 172 Meetinghouse Cir
- 166 Meetinghouse Cir
- 10 Noyes St
- 19 Noyes St
- 160 Meetinghouse Cir
- 1069 Central Ave
- 1028 Central Ave
- 1028 Central Ave Unit 1280
- 1028 Central Ave Unit 1028
- 180 Meetinghouse Cir
- 20 Noyes St
- 152 Meetinghouse Cir
- 33 Mallard Rd
- 39 Mallard Rd
- 1025 Central Ave