4 Fernwood Rd West Hartford, CT 06119
Estimated Value: $1,031,780 - $1,120,000
5
Beds
5
Baths
4,295
Sq Ft
$249/Sq Ft
Est. Value
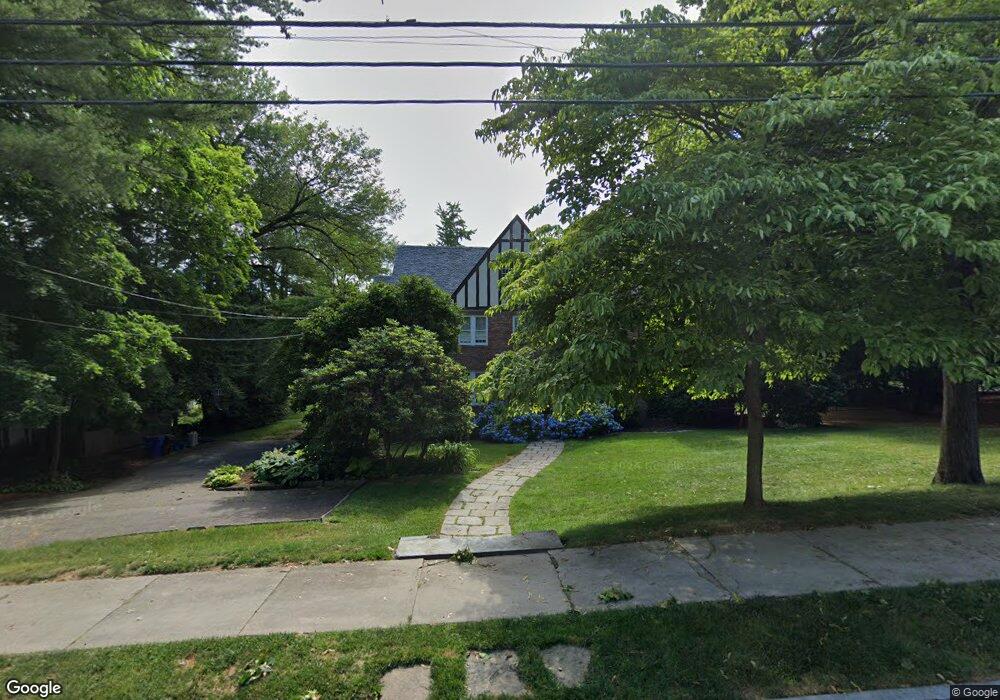
About This Home
This home is located at 4 Fernwood Rd, West Hartford, CT 06119 and is currently estimated at $1,071,593, approximately $249 per square foot. 4 Fernwood Rd is a home located in Hartford County with nearby schools including Whiting Lane School, King Philip Middle School, and Hall High School.
Ownership History
Date
Name
Owned For
Owner Type
Purchase Details
Closed on
Mar 31, 2022
Sold by
Starr Peter D and Starr Jennifer L
Bought by
Sullivan Jack B
Current Estimated Value
Purchase Details
Closed on
Sep 26, 1997
Sold by
Berube Edward M
Bought by
Proft Mark R
Purchase Details
Closed on
Jan 12, 1993
Sold by
Andrulonis Paul
Bought by
Berube Edward
Create a Home Valuation Report for This Property
The Home Valuation Report is an in-depth analysis detailing your home's value as well as a comparison with similar homes in the area
Home Values in the Area
Average Home Value in this Area
Purchase History
| Date | Buyer | Sale Price | Title Company |
|---|---|---|---|
| Sullivan Jack B | $190,000 | None Available | |
| Proft Mark R | $420,000 | -- | |
| Berube Edward | $431,818 | -- |
Source: Public Records
Mortgage History
| Date | Status | Borrower | Loan Amount |
|---|---|---|---|
| Previous Owner | Berube Edward | $167,500 | |
| Previous Owner | Berube Edward | $390,000 | |
| Previous Owner | Berube Edward | $333,700 |
Source: Public Records
Tax History Compared to Growth
Tax History
| Year | Tax Paid | Tax Assessment Tax Assessment Total Assessment is a certain percentage of the fair market value that is determined by local assessors to be the total taxable value of land and additions on the property. | Land | Improvement |
|---|---|---|---|---|
| 2025 | $22,408 | $500,400 | $172,800 | $327,600 |
| 2024 | $21,192 | $500,400 | $172,800 | $327,600 |
| 2023 | $20,476 | $500,400 | $172,800 | $327,600 |
| 2022 | $20,356 | $500,400 | $172,800 | $327,600 |
| 2021 | $20,688 | $487,690 | $169,300 | $318,390 |
| 2020 | $20,385 | $487,690 | $178,300 | $309,390 |
| 2019 | $20,385 | $487,690 | $178,290 | $309,400 |
| 2018 | $19,338 | $471,660 | $178,290 | $293,370 |
| 2017 | $19,357 | $471,660 | $178,290 | $293,370 |
| 2016 | $19,612 | $496,370 | $161,350 | $335,020 |
| 2015 | $19,016 | $496,370 | $161,350 | $335,020 |
| 2014 | $18,549 | $496,370 | $161,350 | $335,020 |
Source: Public Records
Map
Nearby Homes
- 237 Fern St Unit 314
- 129 Steele Rd
- 9 Concord St Unit B1
- 6 W Hill Dr
- 12 Farnham Rd
- 10 Farnham Rd
- 8 Lexington Rd
- 302 Quaker Ln N
- 4 Frederick Rd
- 16 Lilley Rd
- 260 Oxford St Unit 262
- 293 Oxford St
- 120 Whitney St
- 130 Tremont St
- 51 Bretton Rd
- 62 Whitney St
- 3 Trumbull Ln
- 209 Warrenton Ave
- 356 Fern St
- 520 Prospect Ave