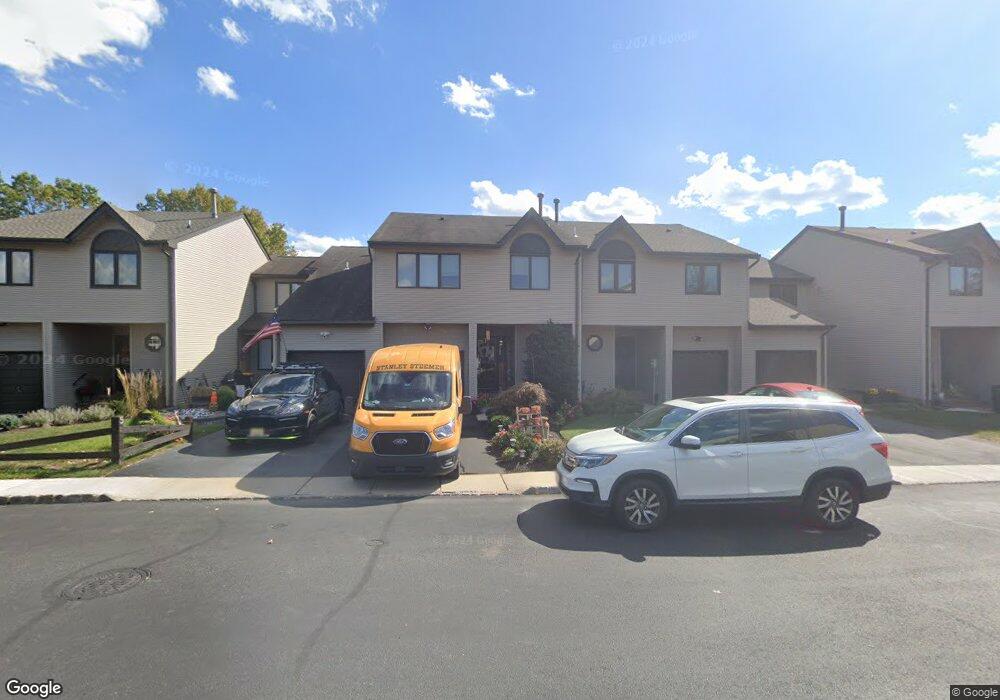
4 Fir Ct Flemington, NJ 08822
Estimated Value: $452,239 - $509,000
Studio
--
Bath
1,740
Sq Ft
$279/Sq Ft
Est. Value
About This Home
This home is located at 4 Fir Ct, Flemington, NJ 08822 and is currently estimated at $485,560, approximately $279 per square foot. 4 Fir Ct is a home located in Hunterdon County with nearby schools including Barley Sheaf Elementary School, J.P. Case Middle School, and Reading Fleming Intermediate School.
Ownership History
Date
Name
Owned For
Owner Type
Purchase Details
Closed on
Jul 21, 2004
Sold by
Schonman Timothy M and Schonman Armine A
Bought by
Hayes Denise C
Current Estimated Value
Home Financials for this Owner
Home Financials are based on the most recent Mortgage that was taken out on this home.
Original Mortgage
$74,500
Outstanding Balance
$55,998
Interest Rate
6.2%
Mortgage Type
Credit Line Revolving
Estimated Equity
$429,562
Purchase Details
Closed on
Oct 1, 1999
Sold by
Favre Brian K
Bought by
Schonman Timothy M and Schonman Armine A
Home Financials for this Owner
Home Financials are based on the most recent Mortgage that was taken out on this home.
Original Mortgage
$112,000
Interest Rate
7.85%
Purchase Details
Closed on
Oct 8, 1996
Sold by
Herrman Carl and Herrman Kathleen
Bought by
Rogus Denise and Favre Brian K
Home Financials for this Owner
Home Financials are based on the most recent Mortgage that was taken out on this home.
Original Mortgage
$127,300
Interest Rate
8.06%
Purchase Details
Closed on
Dec 6, 1991
Sold by
Lenskold Daniel J and Lenskold Richard
Bought by
Herrman Carl and Kathleen Kennedy
Create a Home Valuation Report for This Property
The Home Valuation Report is an in-depth analysis detailing your home's value as well as a comparison with similar homes in the area
Home Values in the Area
Average Home Value in this Area
Purchase History
| Date | Buyer | Sale Price | Title Company |
|---|---|---|---|
| Hayes Denise C | $305,000 | -- | |
| Schonman Timothy M | $140,000 | -- | |
| Rogus Denise | $134,000 | -- | |
| Herrman Carl | $134,000 | -- |
Source: Public Records
Mortgage History
| Date | Status | Borrower | Loan Amount |
|---|---|---|---|
| Open | Hayes Denise C | $74,500 | |
| Open | Hayes Denise C | $200,000 | |
| Previous Owner | Schonman Timothy M | $112,000 | |
| Previous Owner | Rogus Denise | $127,300 |
Source: Public Records
Tax History
| Year | Tax Paid | Tax Assessment Tax Assessment Total Assessment is a certain percentage of the fair market value that is determined by local assessors to be the total taxable value of land and additions on the property. | Land | Improvement |
|---|---|---|---|---|
| 2025 | $7,810 | $269,600 | $110,000 | $159,600 |
| 2024 | $7,344 | $269,600 | $110,000 | $159,600 |
Source: Public Records
Map
Nearby Homes
- 269 Spruce Ct Unit 269
- 265 Spruce Ct Unit 265
- 418 Hawthorne Ct
- 107 Samson Dr
- 317 Jamestown Ct
- 822 Poplar Ct Unit 822
- 6 Dogwood Cir
- 211 Reaville Rd
- 208 Blackberry Ct
- 106 Franklin Ct Unit 238
- 6 Elm Terrace
- 12 Higgins Ct
- 908 Reed Ct
- 17 Londonderry Dr
- 603 Nottingham Way
- 10 Penny Ln
- 6 Canterberry Cir
- 3 Meadow Lark Ct
- 18 Burnett Ct
- 1 Walters Ln