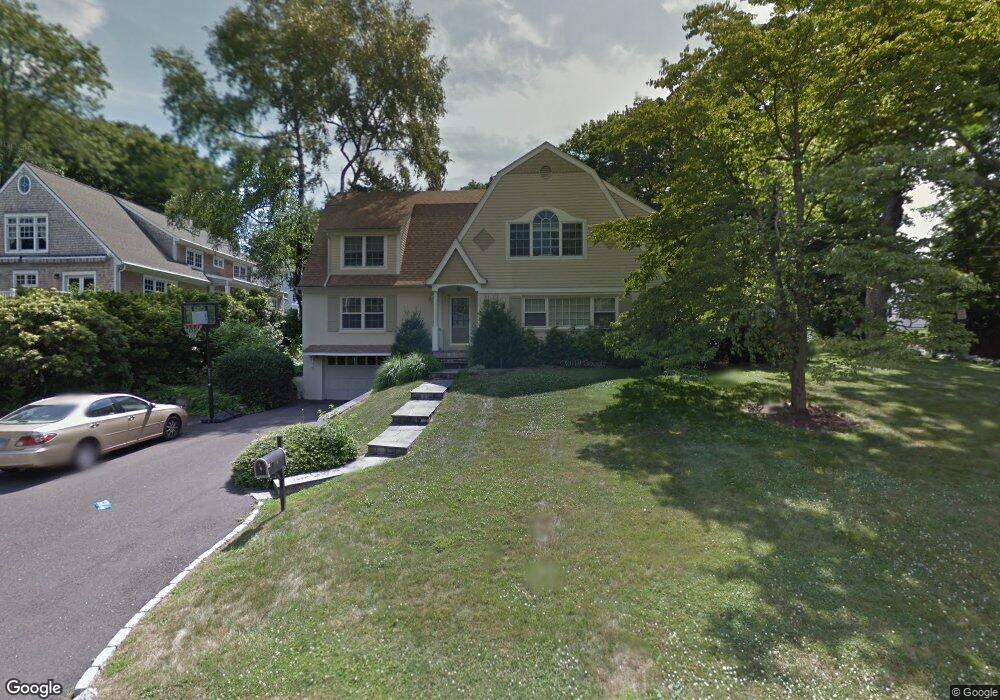
4 Flicker Ln Norwalk, CT 06853
Rowayton NeighborhoodEstimated Value: $1,377,000 - $2,240,000
3
Beds
4
Baths
2,429
Sq Ft
$786/Sq Ft
Est. Value
About This Home
This home is located at 4 Flicker Ln, Norwalk, CT 06853 and is currently estimated at $1,909,791, approximately $786 per square foot. 4 Flicker Ln is a home located in Fairfield County with nearby schools including Rowayton Elementary School, Roton Middle School, and Brien Mcmahon High School.
Ownership History
Date
Name
Owned For
Owner Type
Purchase Details
Closed on
Mar 17, 1997
Sold by
Jepsen John and Jepsen Joann B
Bought by
Schultz Claire M
Current Estimated Value
Home Financials for this Owner
Home Financials are based on the most recent Mortgage that was taken out on this home.
Original Mortgage
$214,600
Interest Rate
7.38%
Mortgage Type
Unknown
Purchase Details
Closed on
Jun 20, 1988
Sold by
Wright Harold
Bought by
Jepson John
Create a Home Valuation Report for This Property
The Home Valuation Report is an in-depth analysis detailing your home's value as well as a comparison with similar homes in the area
Home Values in the Area
Average Home Value in this Area
Purchase History
| Date | Buyer | Sale Price | Title Company |
|---|---|---|---|
| Schultz Claire M | $297,000 | -- | |
| Schultz Claire M | $297,000 | -- | |
| Jepson John | $327,500 | -- |
Source: Public Records
Mortgage History
| Date | Status | Borrower | Loan Amount |
|---|---|---|---|
| Open | Jepson John | $220,000 | |
| Closed | Jepson John | $211,000 | |
| Closed | Jepson John | $214,600 |
Source: Public Records
Tax History Compared to Growth
Tax History
| Year | Tax Paid | Tax Assessment Tax Assessment Total Assessment is a certain percentage of the fair market value that is determined by local assessors to be the total taxable value of land and additions on the property. | Land | Improvement |
|---|---|---|---|---|
| 2025 | $19,782 | $883,420 | $528,130 | $355,290 |
| 2024 | $19,477 | $883,420 | $528,130 | $355,290 |
| 2023 | $14,904 | $622,940 | $372,400 | $250,540 |
| 2022 | $14,287 | $622,940 | $372,400 | $250,540 |
| 2021 | $13,811 | $622,940 | $372,400 | $250,540 |
| 2020 | $13,862 | $622,940 | $372,400 | $250,540 |
| 2019 | $13,328 | $622,940 | $372,400 | $250,540 |
| 2018 | $13,848 | $572,380 | $378,670 | $193,710 |
| 2017 | $13,343 | $572,380 | $378,670 | $193,710 |
| 2016 | $13,130 | $572,380 | $378,670 | $193,710 |
| 2015 | $13,079 | $572,380 | $378,670 | $193,710 |
| 2014 | $12,836 | $572,380 | $378,670 | $193,710 |
Source: Public Records
Map
Nearby Homes
- 1 Flicker Ln
- 9 Flicker Ln
- 20 Indian Spring Rd
- 166 Rowayton Ave Unit 2
- 13 Farm Creek Rd
- 209 Rowayton Ave
- 111 Rowayton Ave Unit 201
- 108 Witch Ln
- 74 Roton Ave
- 181 Highland Ave
- 28 Old Trolley Way
- 15 Yarmouth Rd
- 40 Arnold Ln
- 171 Rowayton Woods Dr Unit 171
- 113 Rowayton Woods Dr
- 73 Devils Garden Rd
- 309 Ely Ave Unit A2
- 19 Littlebrook Rd
- 17 Contentment Island Rd
- 18 Tokeneke Trail