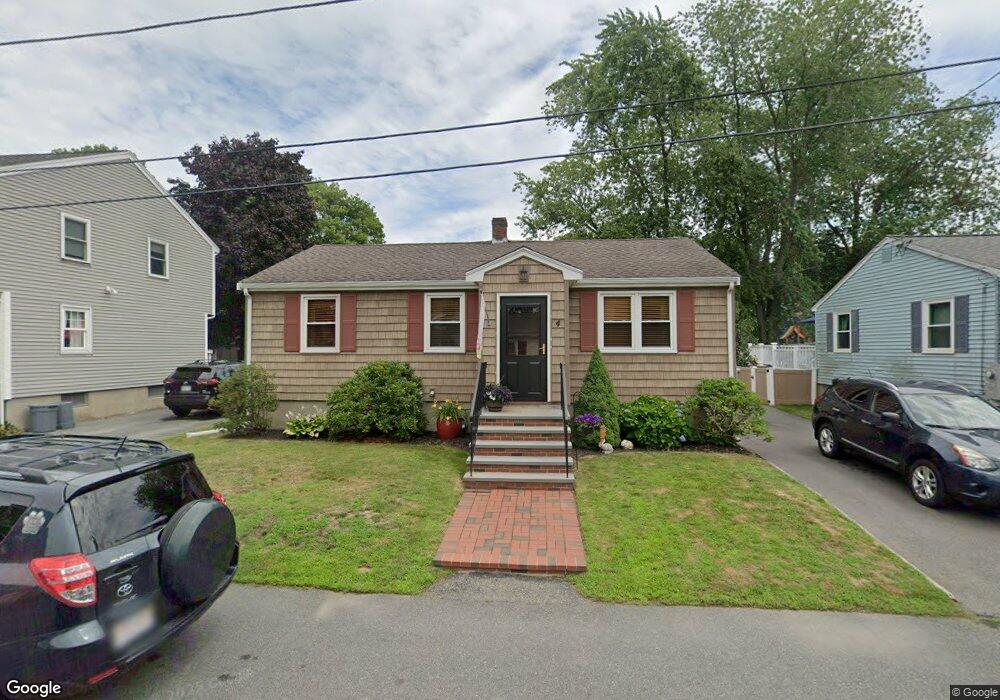
4 Flynn St Salem, MA 01970
Witchcraft Heights NeighborhoodEstimated Value: $526,000 - $570,000
3
Beds
1
Bath
864
Sq Ft
$637/Sq Ft
Est. Value
About This Home
This home is located at 4 Flynn St, Salem, MA 01970 and is currently estimated at $550,082, approximately $636 per square foot. 4 Flynn St is a home located in Essex County with nearby schools including Witchcraft Heights Elementary School, Horace Mann Laboratory, and Bates Elementary School.
Ownership History
Date
Name
Owned For
Owner Type
Purchase Details
Closed on
May 9, 2011
Sold by
Vassy Justine and Vassy Mark P
Bought by
Vassy Ft
Current Estimated Value
Purchase Details
Closed on
Nov 30, 2009
Sold by
Urbanowicz Richard
Bought by
Vassy Justine
Home Financials for this Owner
Home Financials are based on the most recent Mortgage that was taken out on this home.
Original Mortgage
$190,000
Interest Rate
4.79%
Purchase Details
Closed on
Mar 24, 2000
Sold by
Urbanowicz Richard and Urbanowicz Janey E
Bought by
Urbanowicz Richard and Vassy Justine
Purchase Details
Closed on
Nov 30, 1999
Sold by
Gilb Paula H and Sullivan Lucille H
Bought by
Urbanowicz Richard and Urbanowicz Janey E
Home Financials for this Owner
Home Financials are based on the most recent Mortgage that was taken out on this home.
Original Mortgage
$158,000
Interest Rate
7.77%
Mortgage Type
Purchase Money Mortgage
Create a Home Valuation Report for This Property
The Home Valuation Report is an in-depth analysis detailing your home's value as well as a comparison with similar homes in the area
Home Values in the Area
Average Home Value in this Area
Purchase History
| Date | Buyer | Sale Price | Title Company |
|---|---|---|---|
| Vassy Ft | -- | -- | |
| Vassy Justine | -- | -- | |
| Urbanowicz Richard | $158,950 | -- | |
| Urbanowicz Richard | $167,000 | -- |
Source: Public Records
Mortgage History
| Date | Status | Borrower | Loan Amount |
|---|---|---|---|
| Previous Owner | Urbanowicz Richard | $190,000 | |
| Previous Owner | Urbanowicz Richard | $158,000 |
Source: Public Records
Tax History Compared to Growth
Tax History
| Year | Tax Paid | Tax Assessment Tax Assessment Total Assessment is a certain percentage of the fair market value that is determined by local assessors to be the total taxable value of land and additions on the property. | Land | Improvement |
|---|---|---|---|---|
| 2025 | $5,339 | $470,800 | $178,800 | $292,000 |
| 2024 | $5,450 | $469,000 | $178,800 | $290,200 |
| 2023 | $5,194 | $415,200 | $163,600 | $251,600 |
| 2022 | $4,798 | $362,100 | $157,600 | $204,500 |
| 2021 | $4,797 | $347,600 | $157,600 | $190,000 |
| 2020 | $4,627 | $320,200 | $148,500 | $171,700 |
| 2019 | $4,479 | $296,600 | $141,200 | $155,400 |
| 2018 | $4,368 | $284,000 | $134,500 | $149,500 |
| 2017 | $4,333 | $273,200 | $127,300 | $145,900 |
| 2016 | $4,043 | $258,000 | $112,100 | $145,900 |
| 2015 | $3,740 | $227,900 | $103,000 | $124,900 |
Source: Public Records
Map
Nearby Homes
- 176 Marlborough Rd
- 159 Marlborough Rd
- 46 Sutton St
- 25 Outlook Ave
- 13 State St
- 9 Sutton St
- 2 Osborne St
- 11 Osborne Hill Dr
- 57 Ord St
- 111 Foster St Unit 401
- 111 Foster St Unit 416
- 36 Summit St
- 15 Wall St
- 36 Valley St
- 38 Valley St
- 21 Chanelle Cir
- 55 Butler St
- 145 Boston St
- 128 Boston St Unit 4
- 48 Franklin St