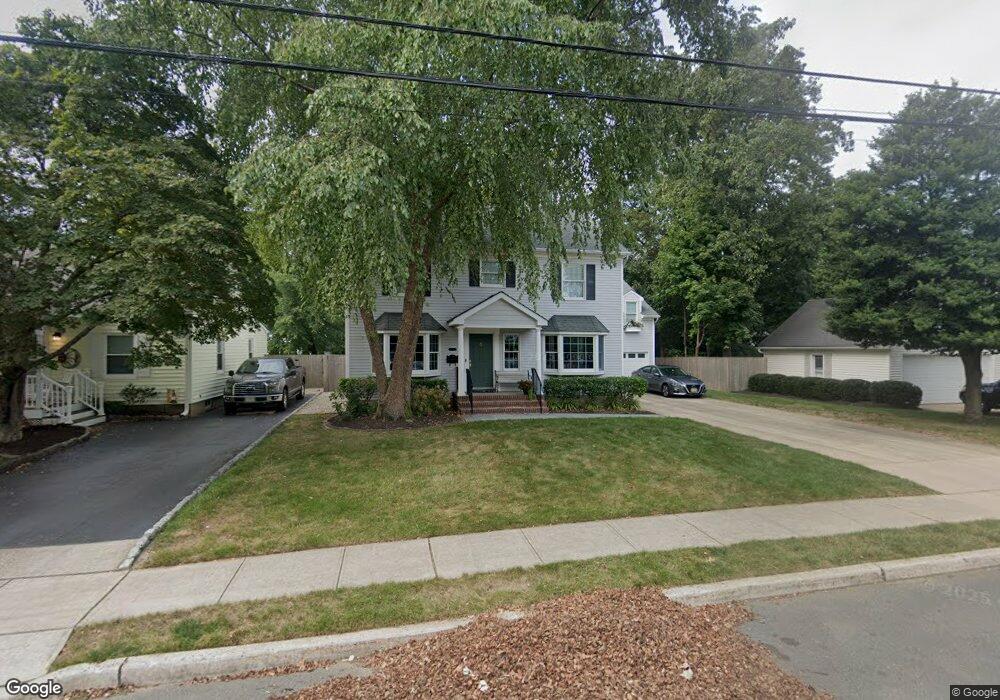
4 Forrest Ave Rumson, NJ 07760
Estimated Value: $1,617,221 - $1,981,000
5
Beds
3
Baths
2,806
Sq Ft
$622/Sq Ft
Est. Value
About This Home
This home is located at 4 Forrest Ave, Rumson, NJ 07760 and is currently estimated at $1,746,305, approximately $622 per square foot. 4 Forrest Ave is a home located in Monmouth County with nearby schools including Deane Porter School, Forrestdale School, and Rumson Fair Haven Regional High School.
Ownership History
Date
Name
Owned For
Owner Type
Purchase Details
Closed on
Nov 12, 1992
Bought by
Nixon Jeffrey S and Nixon Holly B
Current Estimated Value
Create a Home Valuation Report for This Property
The Home Valuation Report is an in-depth analysis detailing your home's value as well as a comparison with similar homes in the area
Home Values in the Area
Average Home Value in this Area
Purchase History
| Date | Buyer | Sale Price | Title Company |
|---|---|---|---|
| Nixon Jeffrey S | -- | -- |
Source: Public Records
Tax History
| Year | Tax Paid | Tax Assessment Tax Assessment Total Assessment is a certain percentage of the fair market value that is determined by local assessors to be the total taxable value of land and additions on the property. | Land | Improvement |
|---|---|---|---|---|
| 2025 | $14,705 | $1,418,600 | $919,300 | $499,300 |
| 2024 | $14,368 | $1,336,800 | $882,400 | $454,400 |
| 2023 | $14,368 | $1,229,100 | $817,200 | $411,900 |
| 2022 | $13,884 | $1,110,300 | $723,300 | $387,000 |
| 2021 | $13,884 | $975,700 | $626,200 | $349,500 |
| 2020 | $12,917 | $901,400 | $569,300 | $332,100 |
| 2019 | $12,212 | $831,300 | $368,700 | $462,600 |
| 2018 | $12,001 | $809,800 | $368,700 | $441,100 |
| 2017 | $11,178 | $760,900 | $333,300 | $427,600 |
| 2016 | $10,750 | $750,200 | $333,300 | $416,900 |
| 2015 | $10,627 | $731,400 | $333,300 | $398,100 |
| 2014 | $10,391 | $713,200 | $325,900 | $387,300 |
Source: Public Records
Map
Nearby Homes
Your Personal Tour Guide
Ask me questions while you tour the home.