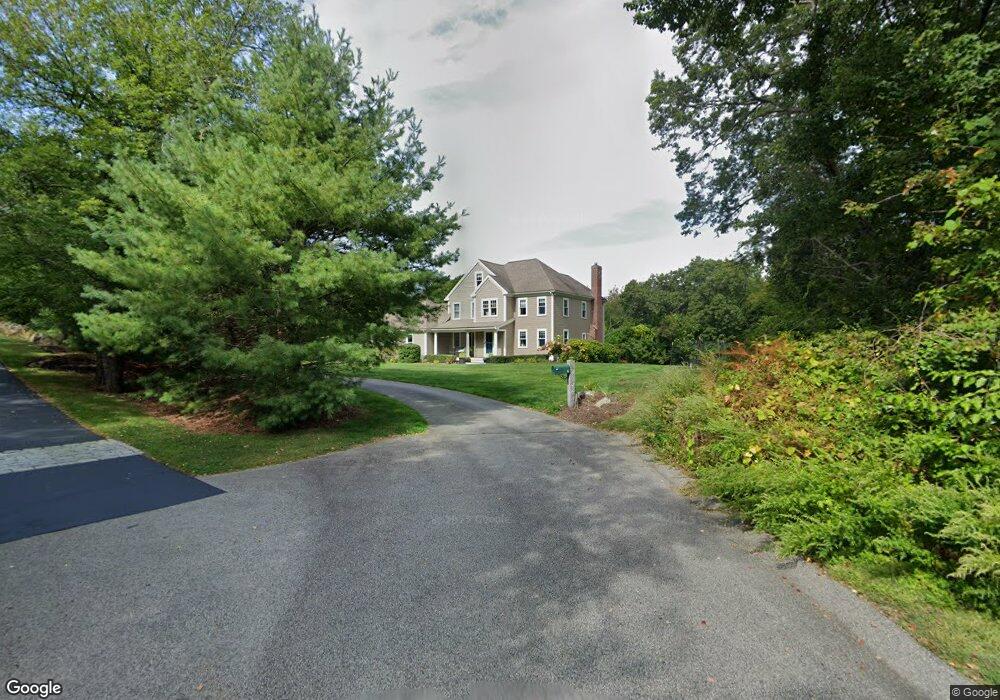
4 Foundry Falls Rd Hingham, MA 02043
Estimated Value: $1,430,000 - $2,087,000
5
Beds
4
Baths
2,736
Sq Ft
$647/Sq Ft
Est. Value
About This Home
This home is located at 4 Foundry Falls Rd, Hingham, MA 02043 and is currently estimated at $1,771,340, approximately $647 per square foot. 4 Foundry Falls Rd is a home located in Plymouth County with nearby schools including East Elementary School, Hingham Middle School, and Hingham High School.
Ownership History
Date
Name
Owned For
Owner Type
Purchase Details
Closed on
Jan 20, 2021
Sold by
Kwong Eugene and Kwong Judy S
Bought by
Kwong Ft
Current Estimated Value
Purchase Details
Closed on
Nov 19, 2010
Sold by
Iaria David and Iaria Leslie
Bought by
Kwong Eugene and Kwong Judy Soohoo
Home Financials for this Owner
Home Financials are based on the most recent Mortgage that was taken out on this home.
Original Mortgage
$140,000
Interest Rate
4.46%
Purchase Details
Closed on
Apr 2, 2004
Sold by
Iaria Rt and Iara Domenic P
Bought by
Iaria David and Iaria Leslie
Create a Home Valuation Report for This Property
The Home Valuation Report is an in-depth analysis detailing your home's value as well as a comparison with similar homes in the area
Purchase History
| Date | Buyer | Sale Price | Title Company |
|---|---|---|---|
| Kwong Ft | -- | None Available | |
| Kwong Eugene | $825,000 | -- | |
| Iaria David | -- | -- |
Source: Public Records
Mortgage History
| Date | Status | Borrower | Loan Amount |
|---|---|---|---|
| Previous Owner | Iaria David | $140,000 | |
| Previous Owner | Kwong Eugene | $417,000 | |
| Previous Owner | Iaria David | $140,000 | |
| Previous Owner | Iaria David | $200,000 |
Source: Public Records
Tax History
| Year | Tax Paid | Tax Assessment Tax Assessment Total Assessment is a certain percentage of the fair market value that is determined by local assessors to be the total taxable value of land and additions on the property. | Land | Improvement |
|---|---|---|---|---|
| 2025 | $15,107 | $1,413,200 | $587,900 | $825,300 |
| 2024 | $13,611 | $1,254,500 | $587,900 | $666,600 |
| 2023 | $12,321 | $1,232,100 | $587,900 | $644,200 |
| 2022 | $12,560 | $1,086,500 | $472,400 | $614,100 |
| 2021 | $5,880 | $1,022,900 | $472,400 | $550,500 |
| 2020 | $11,794 | $1,022,900 | $472,400 | $550,500 |
| 2019 | $5,365 | $989,700 | $472,400 | $517,300 |
| 2018 | $5,038 | $923,800 | $472,400 | $451,400 |
| 2017 | $10,121 | $826,200 | $462,600 | $363,600 |
| 2016 | $10,054 | $805,000 | $441,400 | $363,600 |
| 2015 | $10,817 | $863,300 | $421,000 | $442,300 |
Source: Public Records
Map
Nearby Homes
- LOT 1B Rockland St
- 101 Rockland St
- 8 Evergreen Ln
- 114 Hull St
- 2 Cliff Rd
- 1 Rockland St
- 166 Hull St
- 112 Martins Ln
- 9 Barnes Rd
- 82 East St
- 65 East St
- 33 Turkey Hill Ln
- 2 Woodbine Ln
- 23 Wyola Rd
- 22 Berkley Rd Unit B
- 121 Nantasket Ave Unit 503
- 4 Atherton Rd
- 10 Popes Ln
- 1 Longbeach Ave Unit 202
- 18 Valley Beach Ave
Your Personal Tour Guide
Ask me questions while you tour the home.