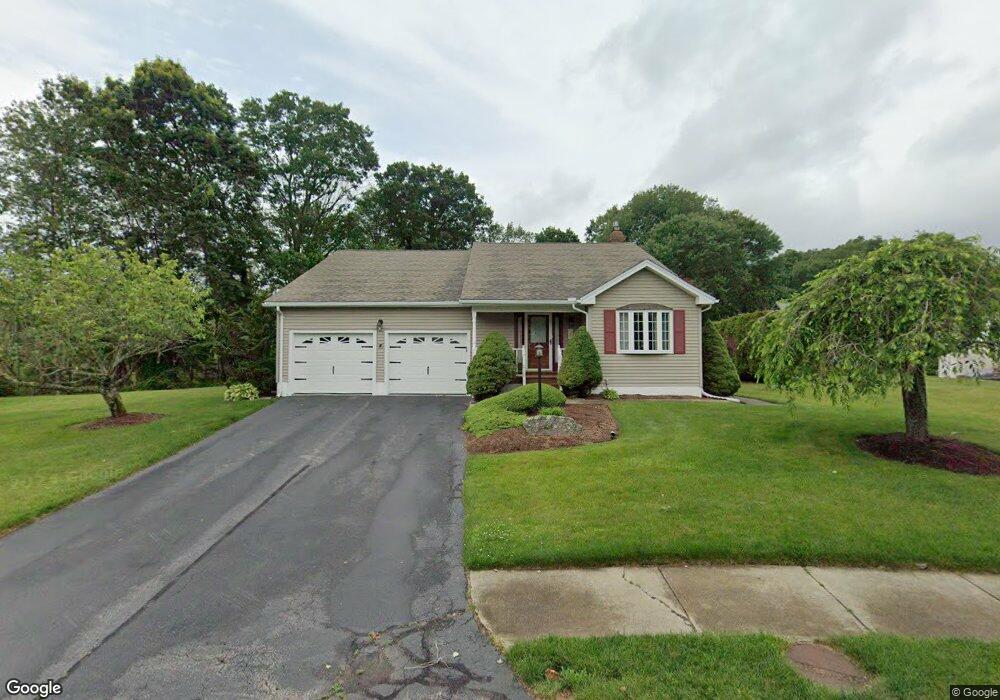
4 Fox Run Cir Auburn, MA 01501
Pondville NeighborhoodEstimated Value: $547,032 - $653,000
3
Beds
2
Baths
1,787
Sq Ft
$328/Sq Ft
Est. Value
About This Home
This home is located at 4 Fox Run Cir, Auburn, MA 01501 and is currently estimated at $585,258, approximately $327 per square foot. 4 Fox Run Cir is a home located in Worcester County with nearby schools including Auburn Senior High School and Shrewsbury Montessori School - Auburn Campus.
Ownership History
Date
Name
Owned For
Owner Type
Purchase Details
Closed on
Jan 12, 2026
Sold by
Robert D Maclea Irt and Maclea
Bought by
Macaruso Josephine and Macaruso Joseph A
Current Estimated Value
Home Financials for this Owner
Home Financials are based on the most recent Mortgage that was taken out on this home.
Original Mortgage
$120,000
Outstanding Balance
$120,000
Interest Rate
6.23%
Mortgage Type
New Conventional
Estimated Equity
$465,258
Purchase Details
Closed on
Jul 31, 2017
Sold by
Maclea Lorraine L
Bought by
Lorraine L Maclea Irt and Maclea
Purchase Details
Closed on
Oct 31, 2005
Sold by
Tower Arthur R and Tower Ivy D
Bought by
Maclea Lorraine L and Maclea Robert D
Home Financials for this Owner
Home Financials are based on the most recent Mortgage that was taken out on this home.
Original Mortgage
$311,920
Interest Rate
5.79%
Mortgage Type
Purchase Money Mortgage
Purchase Details
Closed on
Dec 18, 1998
Sold by
New Birchwood I Corp
Bought by
Tower Arthur R and Tower Ivy D
Home Financials for this Owner
Home Financials are based on the most recent Mortgage that was taken out on this home.
Original Mortgage
$72,000
Interest Rate
6.85%
Mortgage Type
Purchase Money Mortgage
Create a Home Valuation Report for This Property
The Home Valuation Report is an in-depth analysis detailing your home's value as well as a comparison with similar homes in the area
Home Values in the Area
Average Home Value in this Area
Purchase History
| Date | Buyer | Sale Price | Title Company |
|---|---|---|---|
| Macaruso Josephine | $600,000 | -- | |
| Lorraine L Maclea Irt | -- | -- | |
| Robert D Maclea 2016 I D | -- | -- | |
| Maclea Robert D | -- | -- | |
| Maclea Lorraine L | $389,900 | -- | |
| Tower Arthur R | $212,000 | -- |
Source: Public Records
Mortgage History
| Date | Status | Borrower | Loan Amount |
|---|---|---|---|
| Open | Macaruso Josephine | $120,000 | |
| Previous Owner | Maclea Lorraine L | $311,920 | |
| Previous Owner | Tower Arthur R | $72,000 |
Source: Public Records
Tax History
| Year | Tax Paid | Tax Assessment Tax Assessment Total Assessment is a certain percentage of the fair market value that is determined by local assessors to be the total taxable value of land and additions on the property. | Land | Improvement |
|---|---|---|---|---|
| 2025 | $66 | $464,200 | $114,500 | $349,700 |
| 2024 | $6,695 | $448,400 | $108,900 | $339,500 |
| 2023 | $6,444 | $405,800 | $99,000 | $306,800 |
| 2022 | $5,922 | $352,100 | $99,000 | $253,100 |
| 2021 | $5,788 | $319,100 | $87,300 | $231,800 |
| 2020 | $5,737 | $319,100 | $87,300 | $231,800 |
| 2019 | $5,694 | $309,100 | $86,400 | $222,700 |
| 2018 | $3,989 | $303,400 | $80,800 | $222,600 |
| 2017 | $5,427 | $295,900 | $73,300 | $222,600 |
| 2016 | $5,201 | $287,500 | $77,000 | $210,500 |
| 2015 | $5,012 | $290,400 | $77,000 | $213,400 |
| 2014 | $4,727 | $273,400 | $73,200 | $200,200 |
Source: Public Records
Map
Nearby Homes
- 6 George St
- 137 South St
- 61 School St
- 8 South Terrace
- 751 Washington St Unit 43A
- 634 Oxford St S
- 36 Central St
- 166 Leicester St
- 303 W Main St
- 49 Prospect St
- 35 Waterman Rd
- 33 Eastford Rd
- 328 Oxford St N
- 808 Washington St
- 31 Walsh Ave
- 31-33 Walsh Ave
- 33 Walsh Ave
- 0 Athens St
- 4 Athens St
- 104 Appleton Rd
Your Personal Tour Guide
Ask me questions while you tour the home.