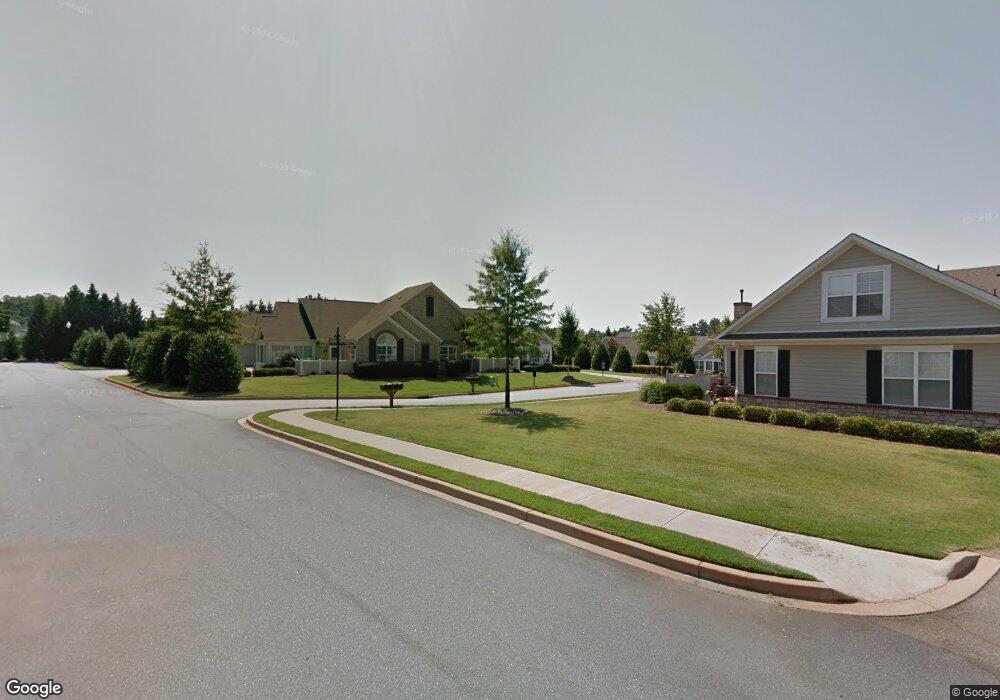
4 Fudora Cir Unit 4 Simpsonville, SC 29681
Estimated Value: $364,000 - $412,000
2
Beds
2
Baths
1,675
Sq Ft
$227/Sq Ft
Est. Value
About This Home
This home is located at 4 Fudora Cir Unit 4, Simpsonville, SC 29681 and is currently estimated at $380,445, approximately $227 per square foot. 4 Fudora Cir Unit 4 is a home located in Greenville County with nearby schools including Monarch Elementary, Hillcrest Middle School, and Mauldin High School.
Ownership History
Date
Name
Owned For
Owner Type
Purchase Details
Closed on
Sep 25, 2020
Sold by
Waskovich Gregory A and Waskovich Donna L
Bought by
Wilson Thomas A and Wilson Linda C
Current Estimated Value
Home Financials for this Owner
Home Financials are based on the most recent Mortgage that was taken out on this home.
Original Mortgage
$216,000
Outstanding Balance
$192,120
Interest Rate
2.9%
Mortgage Type
New Conventional
Estimated Equity
$188,325
Purchase Details
Closed on
Sep 15, 2016
Sold by
Higgins Danny A and Higgins Barbara F
Bought by
Waskovich Gregory A and Waskovich Donna L
Home Financials for this Owner
Home Financials are based on the most recent Mortgage that was taken out on this home.
Original Mortgage
$142,500
Interest Rate
3.43%
Mortgage Type
New Conventional
Purchase Details
Closed on
Aug 20, 2013
Sold by
Branca Catherine A and Branca Michael A
Bought by
Higgins Barbara F and Higgins Danny A
Purchase Details
Closed on
Sep 9, 2008
Sold by
Harring Robert C and Harring Roberta G
Bought by
Branca Michael A and Branca Catherine A
Create a Home Valuation Report for This Property
The Home Valuation Report is an in-depth analysis detailing your home's value as well as a comparison with similar homes in the area
Home Values in the Area
Average Home Value in this Area
Purchase History
| Date | Buyer | Sale Price | Title Company |
|---|---|---|---|
| Wilson Thomas A | $273,500 | None Available | |
| Waskovich Gregory A | $227,500 | None Available | |
| Higgins Barbara F | $189,900 | -- | |
| Higgins Barbara F | $189,900 | -- | |
| Branca Michael A | $225,000 | -- |
Source: Public Records
Mortgage History
| Date | Status | Borrower | Loan Amount |
|---|---|---|---|
| Open | Wilson Thomas A | $216,000 | |
| Previous Owner | Waskovich Gregory A | $142,500 |
Source: Public Records
Tax History Compared to Growth
Tax History
| Year | Tax Paid | Tax Assessment Tax Assessment Total Assessment is a certain percentage of the fair market value that is determined by local assessors to be the total taxable value of land and additions on the property. | Land | Improvement |
|---|---|---|---|---|
| 2024 | $1,192 | $9,820 | $1,440 | $8,380 |
| 2023 | $1,192 | $9,820 | $1,440 | $8,380 |
| 2022 | $4,317 | $14,730 | $2,160 | $12,570 |
| 2021 | $4,252 | $14,730 | $2,160 | $12,570 |
| 2020 | $997 | $8,340 | $1,300 | $7,040 |
| 2019 | $961 | $8,340 | $1,300 | $7,040 |
| 2018 | $1,047 | $8,340 | $1,300 | $7,040 |
| 2017 | $1,351 | $8,340 | $1,300 | $7,040 |
| 2016 | $918 | $195,740 | $32,500 | $163,240 |
| 2015 | $927 | $195,740 | $32,500 | $163,240 |
| 2014 | $1,010 | $210,690 | $32,500 | $178,190 |
Source: Public Records
Map
Nearby Homes
- 122 Fudora Cir
- 75 Fudora Cir Unit 75
- 108 Mineral Ct
- 12 Moss Wood Cir
- 31 Pine Island Dr
- 30 Pine Island Dr
- 200 Dothan Ct
- 107 Carriage Ln
- 3 Chadbourne Ln
- 6 Mendenhall Ct
- 3210 Bethel Rd Unit 66
- 3210 Bethel Rd Unit 44
- 3210 Bethel Rd Unit 18
- 805 Carriage Hill Rd
- 2 Cricken Tree Dr
- 12 Tanner Hall Ln
- 206 Waverly Hall Ln
- 1 Gilder Trace
- 205 Waverly Hall Ln
- 710 Pineapple Pointe Unit 606 Apricot Ln
- 6 Fudora Cir
- 2 Fudora Cir Unit 2
- 200 Impasse Ln Unit 200
- 5 Fudora Cir Unit 5
- 1 Fudora Cir Unit 1
- 136 Fudora Cir
- 10 Fudora Cir Unit 10
- 201 Impasse Ln Unit 201
- 138 Fudora Cir Unit 138
- 12 Fudora Cir Unit 12
- 3 Fudora Cir
- 7 Fudora Cir Unit 7
- 205 Impasse Ln Unit 205
- 132 Fudora Cir
- 134 Fudora Cir Unit 134
- 16 Fudora Cir Unit 16
- 8 Fudora Cir
- 203 Impasse Ln Unit 203
- 14 Fudora Cir
- 207 Impasse Ln Unit 207