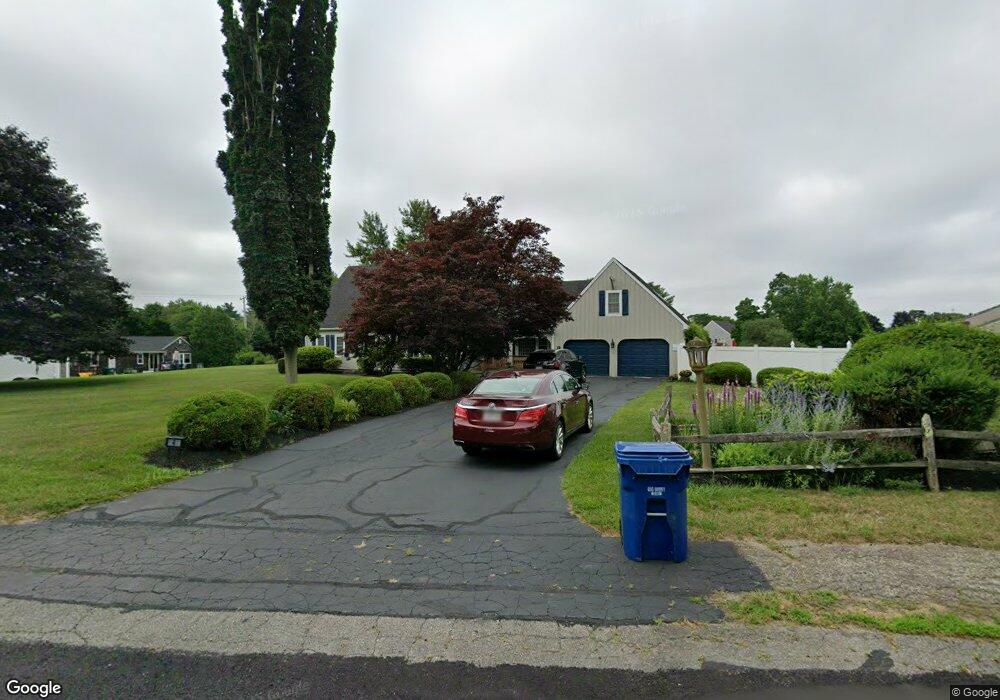
4 Fuller Way Plymouth, MA 02360
Estimated Value: $792,167 - $879,000
3
Beds
4
Baths
2,664
Sq Ft
$314/Sq Ft
Est. Value
About This Home
This home is located at 4 Fuller Way, Plymouth, MA 02360 and is currently estimated at $837,292, approximately $314 per square foot. 4 Fuller Way is a home located in Plymouth County with nearby schools including Federal Furnace Elementary School, Plymouth Community Intermediate, and Plymouth North High School.
Ownership History
Date
Name
Owned For
Owner Type
Purchase Details
Closed on
Sep 21, 2020
Sold by
Delaney D Scott D and Delaney Jean M
Bought by
Delaney Ft and Delaney
Current Estimated Value
Purchase Details
Closed on
May 4, 1992
Sold by
Hoeffner Robert J and Hoeffner Marilyn F
Bought by
Delaney D Scott and Delaney Jean M
Create a Home Valuation Report for This Property
The Home Valuation Report is an in-depth analysis detailing your home's value as well as a comparison with similar homes in the area
Home Values in the Area
Average Home Value in this Area
Purchase History
| Date | Buyer | Sale Price | Title Company |
|---|---|---|---|
| Delaney Ft | -- | None Available | |
| Delaney D Scott | $170,000 | -- | |
| Delaney D Scott D | $170,000 | -- |
Source: Public Records
Mortgage History
| Date | Status | Borrower | Loan Amount |
|---|---|---|---|
| Previous Owner | Delaney D Scott D | $31,500 | |
| Previous Owner | Delaney D Scott D | $50,000 | |
| Previous Owner | Delaney D Scott D | $121,500 |
Source: Public Records
Tax History Compared to Growth
Tax History
| Year | Tax Paid | Tax Assessment Tax Assessment Total Assessment is a certain percentage of the fair market value that is determined by local assessors to be the total taxable value of land and additions on the property. | Land | Improvement |
|---|---|---|---|---|
| 2025 | $8,421 | $663,600 | $265,300 | $398,300 |
| 2024 | $8,194 | $636,700 | $252,100 | $384,600 |
| 2023 | $8,067 | $588,400 | $230,100 | $358,300 |
| 2022 | $7,696 | $498,800 | $207,600 | $291,200 |
| 2021 | $7,343 | $454,400 | $207,600 | $246,800 |
| 2020 | $7,179 | $439,100 | $196,600 | $242,500 |
| 2019 | $6,900 | $417,200 | $174,600 | $242,600 |
| 2018 | $6,653 | $404,200 | $163,600 | $240,600 |
| 2017 | $6,277 | $378,600 | $163,600 | $215,000 |
| 2016 | $6,074 | $373,300 | $158,100 | $215,200 |
| 2015 | $5,719 | $368,000 | $152,600 | $215,400 |
| 2014 | $5,476 | $361,900 | $152,600 | $209,300 |
Source: Public Records
Map
Nearby Homes
- 5 Marc Dr Unit 1
- 5 Marc Dr Unit 5
- 5 Marc Dr Unit 8
- 2 Marc Dr Unit 2B2
- 4 Marc Dr Unit 4B3
- 198 Samoset St
- 7 W Hill Rd
- 16 Jan Marie Dr
- 116 Pilgrim Trail
- 62 Jan Marie Dr
- 3 Winter Hollow
- 230 Summer St
- 0 Nathaniel St
- 21 Chapel Hill Dr Unit 3
- 7 Chapel Hill Dr Unit 11
- 9 Chapel Hill Dr Unit 2
- 17 Chapel Hill Dr Unit 3
- 13 Chapel Hill Dr Unit 5
- 144 Industrial Park Rd
- 178 Black Cat Rd