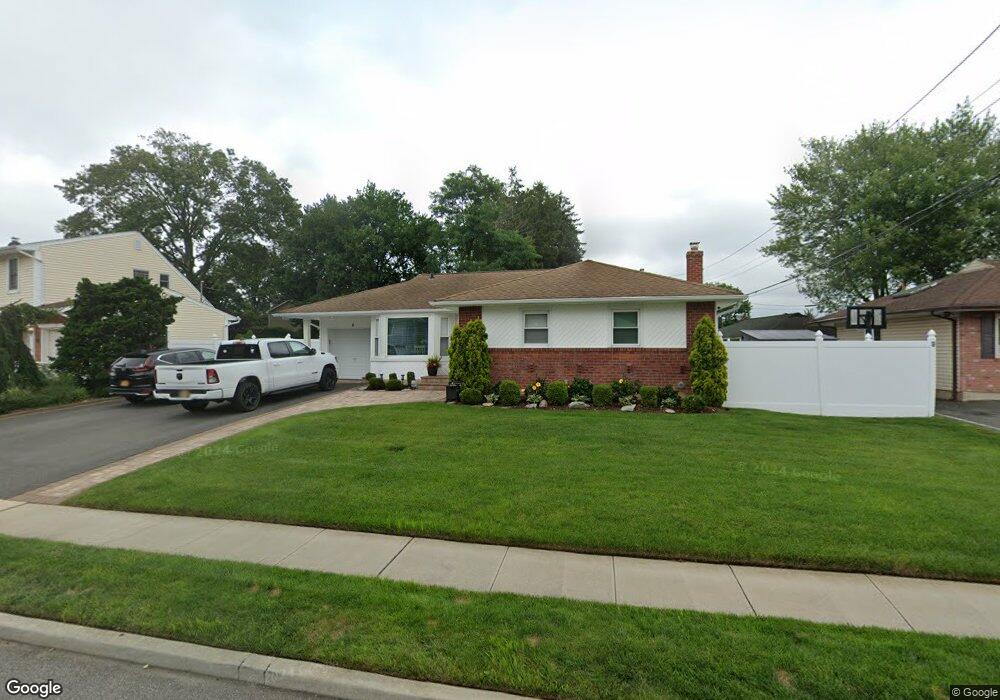
4 Gainsville Dr Plainview, NY 11803
Estimated Value: $865,000 - $893,909
3
Beds
2
Baths
1,291
Sq Ft
$681/Sq Ft
Est. Value
About This Home
This home is located at 4 Gainsville Dr, Plainview, NY 11803 and is currently estimated at $879,455, approximately $681 per square foot. 4 Gainsville Dr is a home located in Nassau County with nearby schools including Judy Jacobs Parkway Elementary School, H B Mattlin Middle School, and Plainview-Old Bethpage John F. Kennedy High School.
Ownership History
Date
Name
Owned For
Owner Type
Purchase Details
Closed on
Mar 15, 2019
Sold by
Henner Marc and Henner Jessica
Bought by
Seabury Alyssa and Noto Philip
Current Estimated Value
Home Financials for this Owner
Home Financials are based on the most recent Mortgage that was taken out on this home.
Original Mortgage
$445,000
Outstanding Balance
$390,434
Interest Rate
4.3%
Mortgage Type
New Conventional
Estimated Equity
$489,021
Purchase Details
Closed on
Nov 24, 2014
Sold by
Glassberg Phyllis
Bought by
Henner Marc and Henner Jessica
Home Financials for this Owner
Home Financials are based on the most recent Mortgage that was taken out on this home.
Original Mortgage
$347,200
Interest Rate
3.93%
Mortgage Type
New Conventional
Purchase Details
Closed on
Jan 8, 2002
Create a Home Valuation Report for This Property
The Home Valuation Report is an in-depth analysis detailing your home's value as well as a comparison with similar homes in the area
Home Values in the Area
Average Home Value in this Area
Purchase History
| Date | Buyer | Sale Price | Title Company |
|---|---|---|---|
| Seabury Alyssa | $570,000 | Chicago Title | |
| Henner Marc | $434,000 | None Available | |
| -- | -- | -- |
Source: Public Records
Mortgage History
| Date | Status | Borrower | Loan Amount |
|---|---|---|---|
| Open | Seabury Alyssa | $445,000 | |
| Previous Owner | Henner Marc | $347,200 |
Source: Public Records
Tax History
| Year | Tax Paid | Tax Assessment Tax Assessment Total Assessment is a certain percentage of the fair market value that is determined by local assessors to be the total taxable value of land and additions on the property. | Land | Improvement |
|---|---|---|---|---|
| 2025 | $14,346 | $483 | $279 | $204 |
| 2024 | $4,309 | $515 | $297 | $218 |
Source: Public Records
Map
Nearby Homes
Your Personal Tour Guide
Ask me questions while you tour the home.