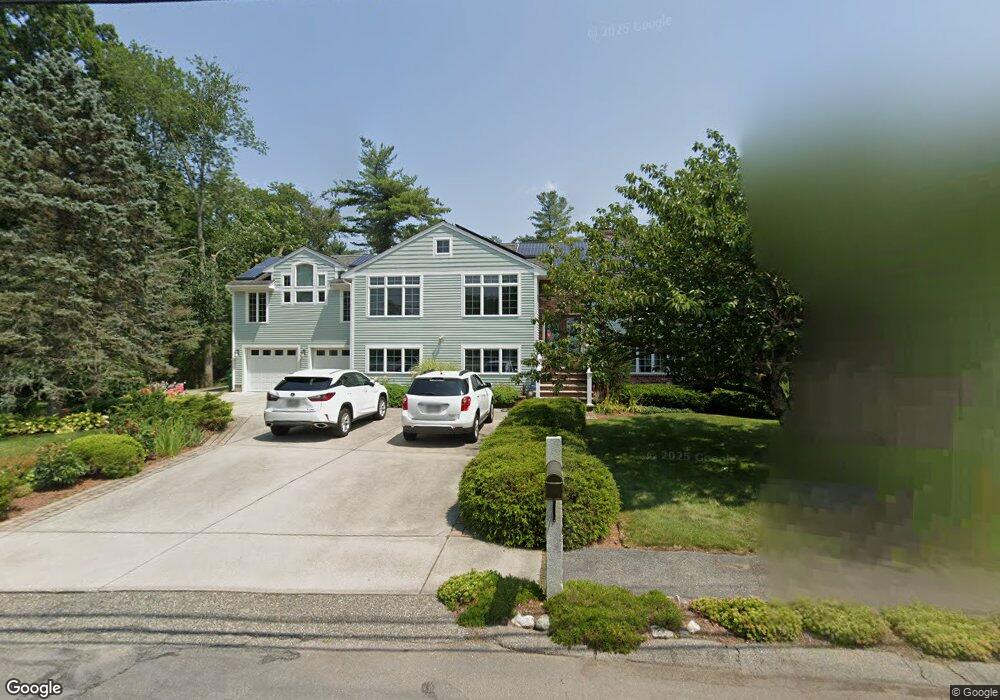
4 Gibson St Burlington, MA 01803
North Burlington NeighborhoodEstimated Value: $932,000 - $1,390,000
4
Beds
3
Baths
3,658
Sq Ft
$335/Sq Ft
Est. Value
About This Home
This home is located at 4 Gibson St, Burlington, MA 01803 and is currently estimated at $1,224,222, approximately $334 per square foot. 4 Gibson St is a home located in Middlesex County with nearby schools including Burlington High School, Fox Hill, and Marshall Simonds Middle School.
Ownership History
Date
Name
Owned For
Owner Type
Purchase Details
Closed on
Jun 2, 1999
Sold by
Welch Lawrence E and Welch Leslie J
Bought by
Schlansky Robert and Schlansky Joanna
Current Estimated Value
Purchase Details
Closed on
Oct 21, 1997
Sold by
Liang Eileen T
Bought by
Welch Lawrence E and Welch Leslie J
Purchase Details
Closed on
Aug 1, 1994
Sold by
Murchie Glenn E and Murchie Sheree L
Bought by
Liang Samuel J and Liang Eileen T
Purchase Details
Closed on
Nov 8, 1993
Sold by
Dcc Dev Inc
Bought by
Sweeney Stephen M and Sweeney Patricia A
Create a Home Valuation Report for This Property
The Home Valuation Report is an in-depth analysis detailing your home's value as well as a comparison with similar homes in the area
Home Values in the Area
Average Home Value in this Area
Purchase History
| Date | Buyer | Sale Price | Title Company |
|---|---|---|---|
| Schlansky Robert | $375,000 | -- | |
| Welch Lawrence E | $310,000 | -- | |
| Liang Samuel J | $243,900 | -- | |
| Sweeney Stephen M | $155,050 | -- |
Source: Public Records
Mortgage History
| Date | Status | Borrower | Loan Amount |
|---|---|---|---|
| Open | Sweeney Stephen M | $185,000 | |
| Closed | Sweeney Stephen M | $195,000 |
Source: Public Records
Tax History Compared to Growth
Tax History
| Year | Tax Paid | Tax Assessment Tax Assessment Total Assessment is a certain percentage of the fair market value that is determined by local assessors to be the total taxable value of land and additions on the property. | Land | Improvement |
|---|---|---|---|---|
| 2025 | $8,630 | $996,500 | $426,000 | $570,500 |
| 2024 | $8,355 | $934,600 | $403,900 | $530,700 |
| 2023 | $8,193 | $871,600 | $350,900 | $520,700 |
| 2022 | $8,091 | $813,200 | $319,900 | $493,300 |
| 2021 | $7,803 | $784,200 | $290,900 | $493,300 |
| 2020 | $7,568 | $785,100 | $290,900 | $494,200 |
| 2019 | $7,492 | $714,900 | $271,900 | $443,000 |
| 2018 | $6,923 | $651,900 | $258,900 | $393,000 |
| 2017 | $6,740 | $651,900 | $258,900 | $393,000 |
| 2016 | $6,703 | $584,900 | $220,900 | $364,000 |
| 2015 | $6,639 | $584,900 | $220,900 | $364,000 |
| 2014 | $6,404 | $533,700 | $200,900 | $332,800 |
Source: Public Records
Map
Nearby Homes