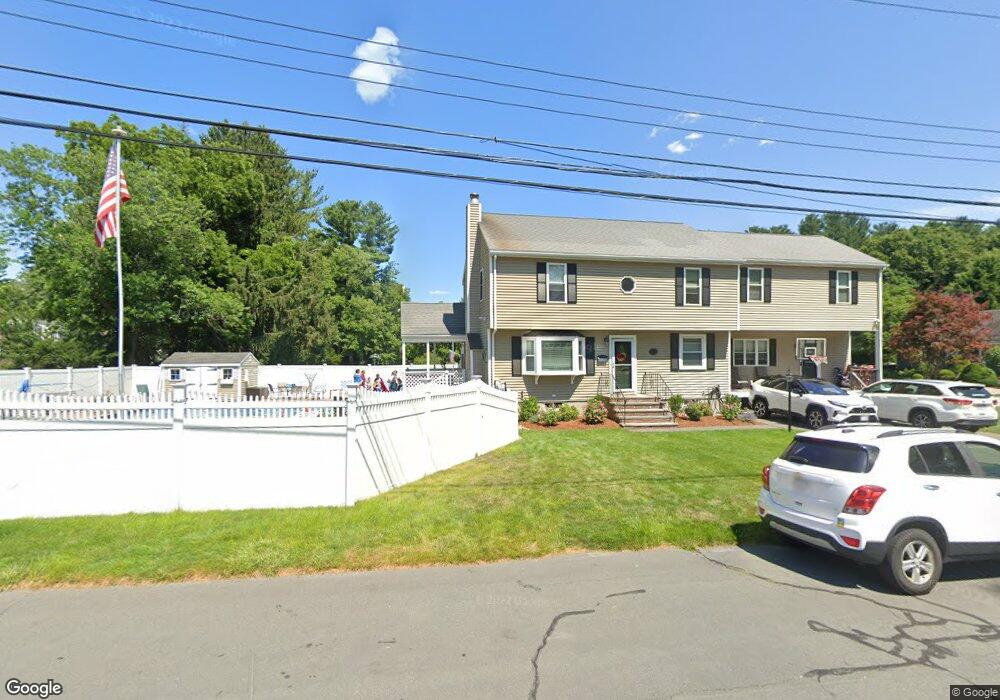
4 Gilmore Rd Framingham, MA 01701
Nobscot NeighborhoodEstimated Value: $710,000 - $805,000
4
Beds
5
Baths
2,356
Sq Ft
$324/Sq Ft
Est. Value
About This Home
This home is located at 4 Gilmore Rd, Framingham, MA 01701 and is currently estimated at $762,559, approximately $323 per square foot. 4 Gilmore Rd is a home located in Middlesex County with nearby schools including Framingham High School, Summit Montessori School, and Saint Bridget School.
Ownership History
Date
Name
Owned For
Owner Type
Purchase Details
Closed on
Aug 25, 1999
Sold by
Murphy Philip F and Murphy Carol H
Bought by
Tosi Joseph W and Tosi Michelle K
Current Estimated Value
Home Financials for this Owner
Home Financials are based on the most recent Mortgage that was taken out on this home.
Original Mortgage
$173,600
Interest Rate
7.53%
Mortgage Type
Purchase Money Mortgage
Create a Home Valuation Report for This Property
The Home Valuation Report is an in-depth analysis detailing your home's value as well as a comparison with similar homes in the area
Home Values in the Area
Average Home Value in this Area
Purchase History
| Date | Buyer | Sale Price | Title Company |
|---|---|---|---|
| Tosi Joseph W | $217,000 | -- |
Source: Public Records
Mortgage History
| Date | Status | Borrower | Loan Amount |
|---|---|---|---|
| Open | Tosi Joseph W | $200,000 | |
| Closed | Tosi Joseph W | $173,600 |
Source: Public Records
Tax History
| Year | Tax Paid | Tax Assessment Tax Assessment Total Assessment is a certain percentage of the fair market value that is determined by local assessors to be the total taxable value of land and additions on the property. | Land | Improvement |
|---|---|---|---|---|
| 2025 | $7,802 | $653,400 | $261,400 | $392,000 |
| 2024 | $7,515 | $603,100 | $233,400 | $369,700 |
| 2023 | $7,241 | $553,200 | $208,400 | $344,800 |
| 2022 | $6,891 | $501,500 | $189,100 | $312,400 |
| 2021 | $6,691 | $476,200 | $181,700 | $294,500 |
| 2020 | $6,741 | $450,000 | $165,100 | $284,900 |
| 2019 | $6,612 | $429,900 | $165,100 | $264,800 |
| 2018 | $6,484 | $397,300 | $159,000 | $238,300 |
| 2017 | $6,216 | $372,000 | $154,300 | $217,700 |
| 2016 | $6,081 | $349,900 | $154,300 | $195,600 |
| 2015 | $5,907 | $331,500 | $154,400 | $177,100 |
Source: Public Records
Map
Nearby Homes
- 51 Woodland Dr
- 472 Brook St
- 484 Edgell Rd
- 32 Lyman Rd
- 2 Grove St
- 356 Central St
- 5 Lavelle Ln
- 44 Agnes Dr
- 2 Hemenway Rd
- 14 Ridgefield Dr
- 231 Central St
- 401 Belknap Rd
- 108 Cherry St
- 11 Bellwood Way
- 7 Ballydrain Rd
- 227 Water St
- 1186 Worcester Rd Unit 610
- 575 Union Ave Unit 1
- 139 Salem End Rd
- 16 Bayberry Ln
Your Personal Tour Guide
Ask me questions while you tour the home.