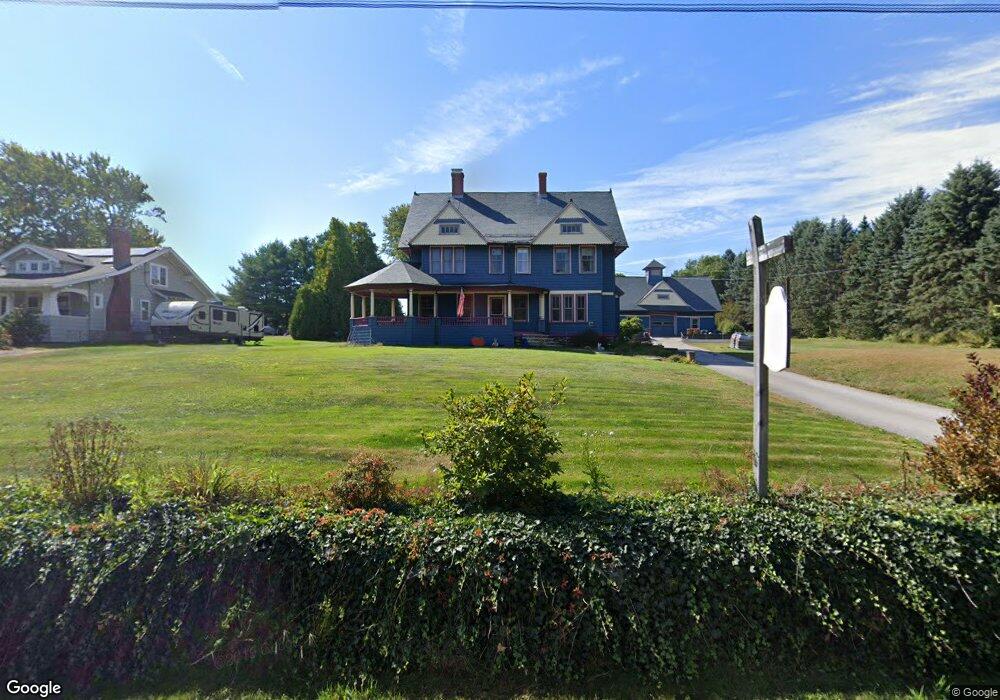
4 Glover Rd Millbury, MA 01527
Estimated Value: $716,244 - $867,000
6
Beds
2
Baths
3,498
Sq Ft
$231/Sq Ft
Est. Value
About This Home
This home is located at 4 Glover Rd, Millbury, MA 01527 and is currently estimated at $807,311, approximately $230 per square foot. 4 Glover Rd is a home located in Worcester County with nearby schools including Elmwood Street Elementary School, Raymond E. Shaw Elementary School, and Millbury Junior/Senior High School.
Ownership History
Date
Name
Owned For
Owner Type
Purchase Details
Closed on
Nov 25, 1992
Sold by
Anderson Dean W
Bought by
Cano Steven B and Cano Robin T
Current Estimated Value
Home Financials for this Owner
Home Financials are based on the most recent Mortgage that was taken out on this home.
Original Mortgage
$155,040
Interest Rate
8.06%
Mortgage Type
Purchase Money Mortgage
Create a Home Valuation Report for This Property
The Home Valuation Report is an in-depth analysis detailing your home's value as well as a comparison with similar homes in the area
Home Values in the Area
Average Home Value in this Area
Purchase History
| Date | Buyer | Sale Price | Title Company |
|---|---|---|---|
| Cano Steven B | $190,000 | -- |
Source: Public Records
Mortgage History
| Date | Status | Borrower | Loan Amount |
|---|---|---|---|
| Open | Cano Steven B | $309,930 | |
| Closed | Cano Steven B | $155,040 |
Source: Public Records
Tax History
| Year | Tax Paid | Tax Assessment Tax Assessment Total Assessment is a certain percentage of the fair market value that is determined by local assessors to be the total taxable value of land and additions on the property. | Land | Improvement |
|---|---|---|---|---|
| 2025 | $8,643 | $645,500 | $124,000 | $521,500 |
| 2024 | $7,942 | $600,300 | $114,700 | $485,600 |
| 2023 | $7,117 | $492,500 | $80,200 | $412,300 |
| 2022 | $6,722 | $448,100 | $80,200 | $367,900 |
| 2021 | $6,686 | $433,300 | $80,200 | $353,100 |
| 2020 | $4,856 | $412,500 | $80,200 | $332,300 |
| 2019 | $6,600 | $416,400 | $72,900 | $343,500 |
| 2018 | $9,619 | $354,900 | $72,900 | $282,000 |
| 2017 | $5,463 | $332,500 | $72,900 | $259,600 |
| 2016 | $5,127 | $311,500 | $72,900 | $238,600 |
| 2015 | $5,029 | $305,500 | $77,600 | $227,900 |
| 2014 | $4,561 | $266,700 | $77,600 | $189,100 |
Source: Public Records
Map
Nearby Homes
- 57 Horne Way Unit 57
- 28 Brierly Cir
- 196 Horne Way Unit 196
- 100 Horne Way
- 29 Winwood Rd
- 0 W Main St
- 37 Sutton Rd
- 0 Auburn Rd
- 11 Laurel Dr
- 6 George St
- 62 School St
- 61 School St
- 354 W Sutton Rd
- 345 W Sutton Rd
- 38 W Main St
- 168 Burbank Rd
- 124 Worcester Providence Turnpike
- 128 Worcester Providence Turnpike
- 15 Westview Dr
- 5 Putnam Hill Rd
Your Personal Tour Guide
Ask me questions while you tour the home.