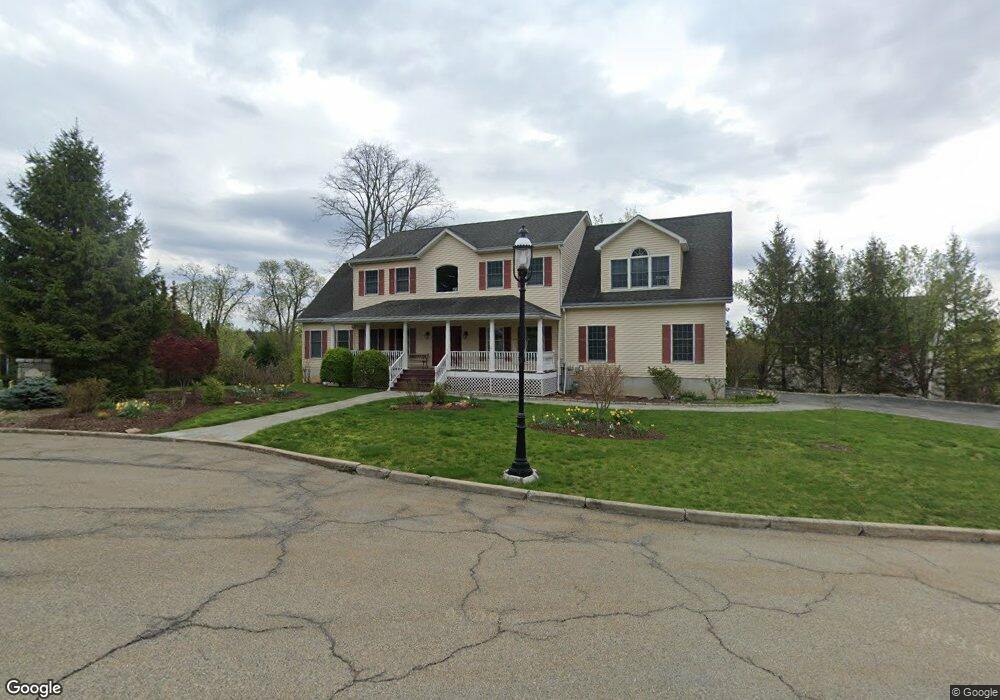
4 Gualtiere Ln Ossining, NY 10562
North Ossining NeighborhoodEstimated Value: $1,030,504 - $1,370,000
4
Beds
4
Baths
2,972
Sq Ft
$383/Sq Ft
Est. Value
About This Home
This home is located at 4 Gualtiere Ln, Ossining, NY 10562 and is currently estimated at $1,136,876, approximately $382 per square foot. 4 Gualtiere Ln is a home located in Westchester County with nearby schools including Park School, Claremont School, and Roosevelt Elementary School.
Ownership History
Date
Name
Owned For
Owner Type
Purchase Details
Closed on
Jul 19, 2002
Sold by
Antonio Velardo Inc
Bought by
Moy Darryl A and Foin Moy Charene
Current Estimated Value
Home Financials for this Owner
Home Financials are based on the most recent Mortgage that was taken out on this home.
Original Mortgage
$300,700
Interest Rate
6.24%
Mortgage Type
Purchase Money Mortgage
Create a Home Valuation Report for This Property
The Home Valuation Report is an in-depth analysis detailing your home's value as well as a comparison with similar homes in the area
Home Values in the Area
Average Home Value in this Area
Purchase History
| Date | Buyer | Sale Price | Title Company |
|---|---|---|---|
| Moy Darryl A | $650,850 | Commonwealth Land Title Ins |
Source: Public Records
Mortgage History
| Date | Status | Borrower | Loan Amount |
|---|---|---|---|
| Previous Owner | Moy Darryl A | $300,700 |
Source: Public Records
Tax History Compared to Growth
Tax History
| Year | Tax Paid | Tax Assessment Tax Assessment Total Assessment is a certain percentage of the fair market value that is determined by local assessors to be the total taxable value of land and additions on the property. | Land | Improvement |
|---|---|---|---|---|
| 2024 | $23,002 | $920,500 | $206,400 | $714,100 |
| 2023 | $22,041 | $854,000 | $206,400 | $647,600 |
| 2022 | $21,679 | $777,000 | $206,400 | $570,600 |
| 2021 | $24,220 | $700,000 | $206,400 | $493,600 |
| 2020 | $26,166 | $720,000 | $206,400 | $513,600 |
| 2019 | $26,084 | $731,100 | $229,300 | $501,800 |
| 2018 | $25,808 | $731,100 | $229,300 | $501,800 |
| 2017 | $16,227 | $724,000 | $229,300 | $494,700 |
| 2016 | $298,288 | $709,800 | $229,300 | $480,500 |
| 2015 | $26,213 | $38,675 | $10,500 | $28,175 |
| 2014 | $26,213 | $38,675 | $10,500 | $28,175 |
| 2013 | $26,213 | $38,675 | $10,500 | $28,175 |
Source: Public Records
Map
Nearby Homes