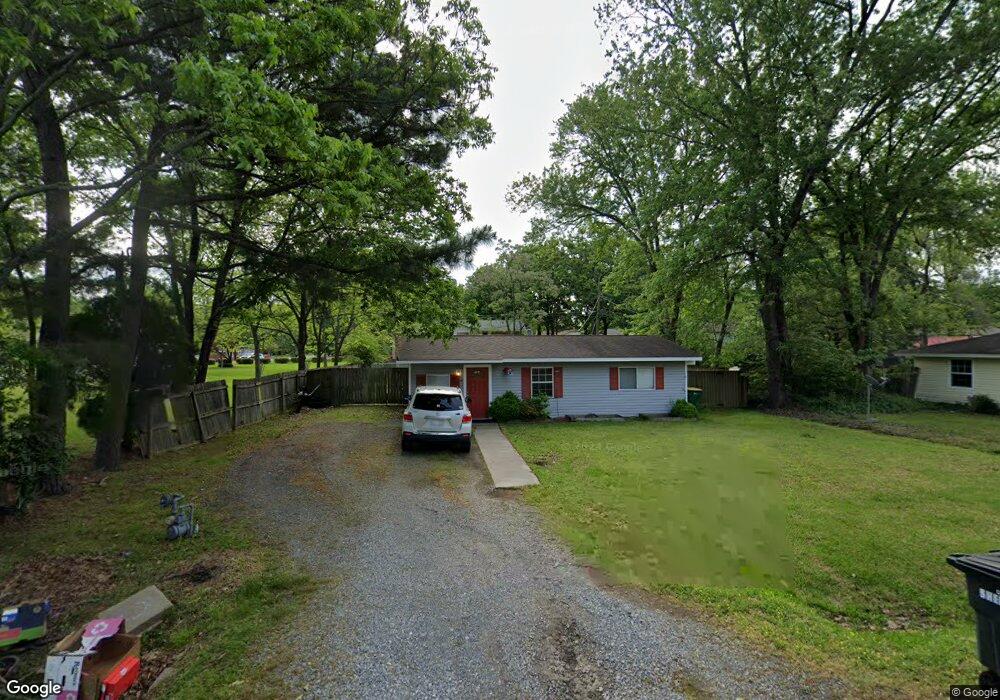
4 Hamilton Park Dr Sherwood, AR 72120
Estimated Value: $74,170 - $124,000
--
Bed
1
Bath
748
Sq Ft
$127/Sq Ft
Est. Value
About This Home
This home is located at 4 Hamilton Park Dr, Sherwood, AR 72120 and is currently estimated at $95,293, approximately $127 per square foot. 4 Hamilton Park Dr is a home located in Pulaski County with nearby schools including Oakbrooke Elementary School, Sylvan Hills Middle School, and Sylvan Hills High School.
Ownership History
Date
Name
Owned For
Owner Type
Purchase Details
Closed on
Mar 5, 2008
Sold by
Pozza Richard J and Pozza Julia D
Bought by
Pozza Christopher R and Pozza Jaclyn M
Current Estimated Value
Home Financials for this Owner
Home Financials are based on the most recent Mortgage that was taken out on this home.
Original Mortgage
$70,000
Outstanding Balance
$42,773
Interest Rate
5.47%
Mortgage Type
Purchase Money Mortgage
Estimated Equity
$52,520
Purchase Details
Closed on
Apr 3, 2007
Sold by
Patrick Nathan Ray and Patrick Joan Rinehart
Bought by
Pozza Richard J and Pozza Julia D
Purchase Details
Closed on
Jan 23, 2003
Sold by
Lasalle Bank Na
Bought by
Patrick Nathan Ray and Patrick Joan Rinehart
Purchase Details
Closed on
Nov 5, 2002
Sold by
Baxter Bridgette J and Baxter Donnie L
Bought by
Lasalle Bank Na
Purchase Details
Closed on
Dec 22, 1997
Sold by
Tate Dene
Bought by
Baxter Donnie L and Baxter Bridgette J
Create a Home Valuation Report for This Property
The Home Valuation Report is an in-depth analysis detailing your home's value as well as a comparison with similar homes in the area
Home Values in the Area
Average Home Value in this Area
Purchase History
| Date | Buyer | Sale Price | Title Company |
|---|---|---|---|
| Pozza Christopher R | $70,000 | Lenders Title Company | |
| Pozza Richard J | $46,000 | Lenders Title Co | |
| Patrick Nathan Ray | $21,666 | Three Rivers Title Services | |
| Lasalle Bank Na | $32,020 | -- | |
| Baxter Donnie L | $10,000 | Beach Abstract & Guaranty Co |
Source: Public Records
Mortgage History
| Date | Status | Borrower | Loan Amount |
|---|---|---|---|
| Open | Pozza Christopher R | $70,000 |
Source: Public Records
Tax History Compared to Growth
Tax History
| Year | Tax Paid | Tax Assessment Tax Assessment Total Assessment is a certain percentage of the fair market value that is determined by local assessors to be the total taxable value of land and additions on the property. | Land | Improvement |
|---|---|---|---|---|
| 2025 | $587 | $11,268 | $2,600 | $8,668 |
| 2024 | $587 | $11,268 | $2,600 | $8,668 |
| 2023 | $587 | $11,268 | $2,600 | $8,668 |
| 2022 | $662 | $11,268 | $2,600 | $8,668 |
| 2021 | $705 | $12,240 | $3,900 | $8,340 |
| 2020 | $326 | $12,240 | $3,900 | $8,340 |
| 2019 | $326 | $12,240 | $3,900 | $8,340 |
| 2018 | $351 | $12,240 | $3,900 | $8,340 |
| 2017 | $346 | $12,240 | $3,900 | $8,340 |
| 2016 | $642 | $12,510 | $5,000 | $7,510 |
| 2015 | $601 | $11,834 | $5,000 | $6,834 |
| 2014 | $601 | $10,854 | $5,000 | $5,854 |
Source: Public Records
Map
Nearby Homes
- 109 Pamela Ln
- 111 Pamela Ln
- 14 Pamela Ln
- 616 E Woodruff Ave
- 2949 Maelstrom Cir
- 9318 Woodbine Sttreet
- 519 Hillcrest Rd
- 9460 Robin Ln
- 1300 E Maryland Ave
- 9125 Woodbine St
- 3032 Overcup Dr
- 59 Wesley Dr
- 2520 Austin Oaks Dr
- Lot 4 Johnson Dr
- 00 Johnson Dr
- Lot 2 Johnson Dr
- Lot 6 Johnson Dr
- Lot 5 Johnson Dr
- Lot 1 Johnson Dr
- 2117 Ingleside Dr
- 6 Hamilton Park Dr
- 904 E Woodruff Ave
- 8 Hamilton Park Dr
- 804 E Woodruff Ave
- 10 Pamela Ln
- 5 Hamilton Park Dr
- 903 E Woodruff Ave
- 7 Hamilton Park Dr
- 10 Hamilton Park Dr
- 0 Hamilton Park Dr Unit 15030682
- 0 Hamilton Park Dr Unit 20028135
- 905 E Woodruff Ave
- 11 Pamela Ln
- 2908 Saratoga Ct
- 801 E Woodruff Ave
- 0 Pamela Ln
- 2900 Saratoga Ct
- 9 Hamilton Park Dr
- 2916 Saratoga Ct
- 2924 Saratoga Ct