Estimated Value: $213,000 - $366,000
4
Beds
1
Bath
1,440
Sq Ft
$221/Sq Ft
Est. Value
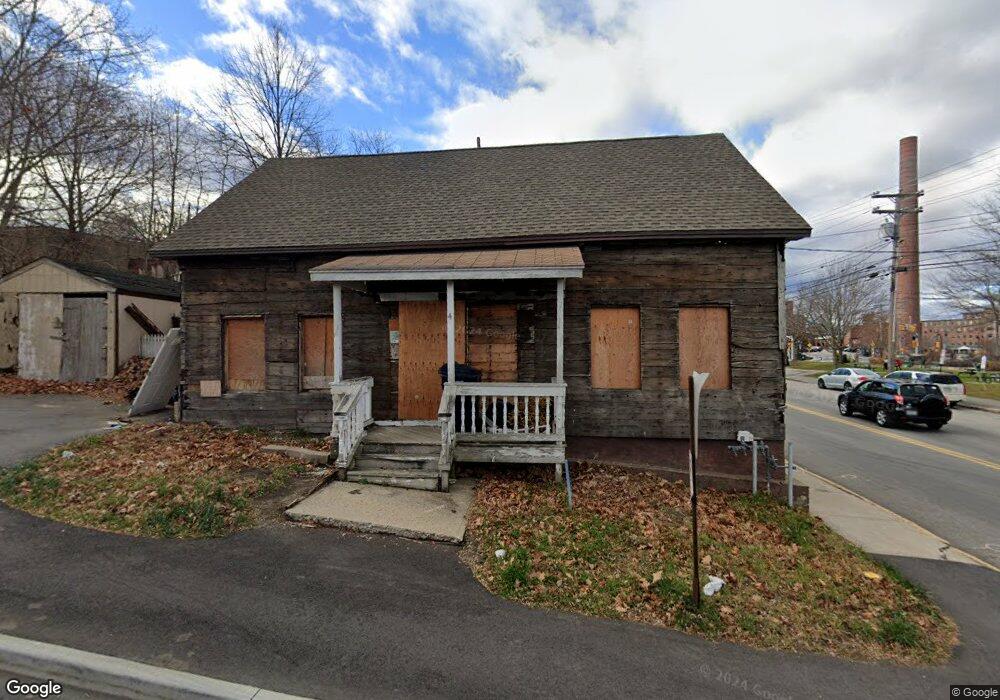
About This Home
This home is located at 4 High St, Biddeford, ME 04005 and is currently estimated at $318,261, approximately $221 per square foot. 4 High St is a home located in York County with nearby schools including John F Kennedy Memorial School, Biddeford Primary School, and Biddeford Intermediate School.
Ownership History
Date
Name
Owned For
Owner Type
Purchase Details
Closed on
Jun 16, 2025
Sold by
Sawin Capital Llc
Bought by
Cutting Edge Renovations
Current Estimated Value
Home Financials for this Owner
Home Financials are based on the most recent Mortgage that was taken out on this home.
Original Mortgage
$250,000
Outstanding Balance
$249,358
Interest Rate
6.81%
Mortgage Type
Purchase Money Mortgage
Estimated Equity
$68,903
Purchase Details
Closed on
Jan 28, 2020
Sold by
Hauslein John D and Hauslein Ruth P
Bought by
Yd Properties Llc
Home Financials for this Owner
Home Financials are based on the most recent Mortgage that was taken out on this home.
Original Mortgage
$167,000
Interest Rate
3.7%
Mortgage Type
New Conventional
Purchase Details
Closed on
Jan 17, 2012
Sold by
Vacation Props Inc
Bought by
Hauslein Ruth P and Hauslein 3Rd John Dawson
Home Financials for this Owner
Home Financials are based on the most recent Mortgage that was taken out on this home.
Original Mortgage
$95,918
Interest Rate
4%
Mortgage Type
New Conventional
Purchase Details
Closed on
Sep 8, 2011
Sold by
Soundview Home Loan T and Deutsche Bank Natl Tco
Bought by
Mecap Llc
Home Financials for this Owner
Home Financials are based on the most recent Mortgage that was taken out on this home.
Original Mortgage
$48,750
Interest Rate
4.58%
Mortgage Type
Purchase Money Mortgage
Purchase Details
Closed on
Apr 11, 2011
Sold by
Hayward Dennis R and Soundview Home Loan T
Bought by
Soundview Home Loan T and Deutsche Bk Natl T Co Tr
Create a Home Valuation Report for This Property
The Home Valuation Report is an in-depth analysis detailing your home's value as well as a comparison with similar homes in the area
Home Values in the Area
Average Home Value in this Area
Purchase History
| Date | Buyer | Sale Price | Title Company |
|---|---|---|---|
| Cutting Edge Renovations | $105,000 | None Available | |
| Cutting Edge Renovations | $105,000 | None Available | |
| Yd Properties Llc | -- | None Available | |
| Yd Properties Llc | -- | None Available | |
| Hauslein Ruth P | -- | -- | |
| Hauslein Ruth P | -- | -- | |
| Mecap Llc | $45,000 | -- | |
| Mecap Llc | $45,000 | -- | |
| Soundview Home Loan T | -- | -- | |
| Soundview Home Loan T | -- | -- |
Source: Public Records
Mortgage History
| Date | Status | Borrower | Loan Amount |
|---|---|---|---|
| Open | Cutting Edge Renovations | $250,000 | |
| Closed | Cutting Edge Renovations | $250,000 | |
| Previous Owner | Yd Properties Llc | $167,000 | |
| Previous Owner | Hauslein Ruth P | $95,918 | |
| Previous Owner | Mecap Llc | $48,750 |
Source: Public Records
Tax History Compared to Growth
Tax History
| Year | Tax Paid | Tax Assessment Tax Assessment Total Assessment is a certain percentage of the fair market value that is determined by local assessors to be the total taxable value of land and additions on the property. | Land | Improvement |
|---|---|---|---|---|
| 2024 | $2,531 | $178,000 | $108,800 | $69,200 |
| 2023 | $2,335 | $178,000 | $108,800 | $69,200 |
| 2022 | $2,311 | $140,800 | $56,300 | $84,500 |
| 2021 | $2,127 | $116,700 | $46,100 | $70,600 |
| 2020 | $2,009 | $100,200 | $35,800 | $64,400 |
| 2019 | $2,002 | $100,200 | $35,800 | $64,400 |
| 2018 | $1,974 | $100,200 | $35,800 | $64,400 |
| 2017 | $1,965 | $97,900 | $35,800 | $62,100 |
| 2016 | $1,944 | $97,900 | $35,800 | $62,100 |
| 2015 | $1,906 | $97,900 | $35,800 | $62,100 |
| 2014 | $1,859 | $97,900 | $35,800 | $62,100 |
| 2013 | -- | $104,300 | $37,300 | $67,000 |
Source: Public Records
Map
Nearby Homes
- 16 Hill St
- 20 Clifford St
- 1 Saco Island Terrace Unit 105
- 1 Saco Island Terrace Unit 337
- 1 Saco Island Terrace Unit 332
- 84 Pike St
- 15 Isle Ave Unit 102
- 2 Main St Unit 17-506
- 2 Main St Unit 15-310
- 2 Main St Unit 15-314
- 2 Main St Unit 17-410
- 2 Main St Unit 17-508
- 2 Main St Unit 15-403
- 2 Main St Unit 17-407
- 2 Main St Unit 18-421
- 2 Main St Unit 18-303
- 2 Main St Unit 18-307
- 2 Main St Unit 15-311
- 2 Main St Unit 35-102
- 11 King St