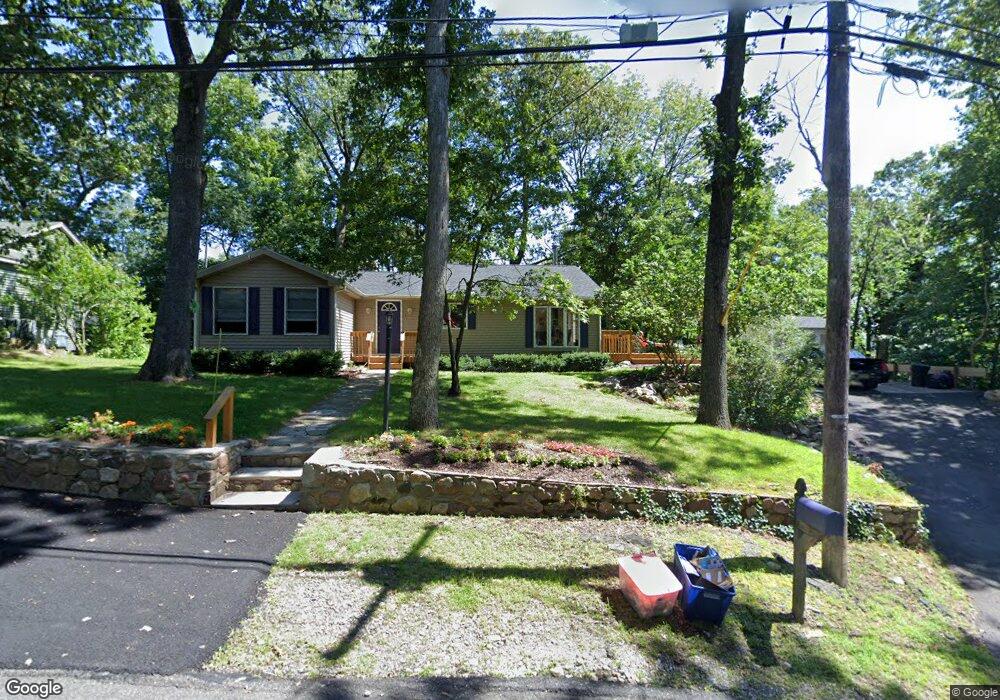
4 High View Trail Jefferson Twp., NJ 07885
Estimated Value: $397,000 - $484,000
3
Beds
1
Bath
1,405
Sq Ft
$315/Sq Ft
Est. Value
About This Home
This home is located at 4 High View Trail, Jefferson Twp., NJ 07885 and is currently estimated at $442,191, approximately $314 per square foot. 4 High View Trail is a home located in Morris County with nearby schools including Jefferson Township Middle School and Jefferson Township High School.
Ownership History
Date
Name
Owned For
Owner Type
Purchase Details
Closed on
Jul 8, 2017
Sold by
Njsl Two Llc
Bought by
Micell Michael and Micell Sarah
Current Estimated Value
Home Financials for this Owner
Home Financials are based on the most recent Mortgage that was taken out on this home.
Original Mortgage
$1,765,000
Outstanding Balance
$1,467,222
Interest Rate
3.91%
Mortgage Type
New Conventional
Estimated Equity
-$1,025,031
Purchase Details
Closed on
Jan 10, 2017
Sold by
The Bank Of New York Mellon
Bought by
Njsl Two Lcl
Purchase Details
Closed on
Sep 9, 2016
Sold by
Larena Peter
Bought by
The Bank Of New York Mellon and The Bank Of New York
Purchase Details
Closed on
Nov 19, 2004
Sold by
Larena Peter
Bought by
Larena Peter and Larena Roxanne
Home Financials for this Owner
Home Financials are based on the most recent Mortgage that was taken out on this home.
Original Mortgage
$226,497
Interest Rate
7.75%
Mortgage Type
Adjustable Rate Mortgage/ARM
Create a Home Valuation Report for This Property
The Home Valuation Report is an in-depth analysis detailing your home's value as well as a comparison with similar homes in the area
Home Values in the Area
Average Home Value in this Area
Purchase History
| Date | Buyer | Sale Price | Title Company |
|---|---|---|---|
| Micell Michael | $250,000 | Nrt Title Agency Llc | |
| Njsl Two Lcl | $860,000 | All Head Title Agency Llc | |
| The Bank Of New York Mellon | -- | None Available | |
| Larena Peter | -- | -- |
Source: Public Records
Mortgage History
| Date | Status | Borrower | Loan Amount |
|---|---|---|---|
| Open | Micell Michael | $1,765,000 | |
| Previous Owner | Larena Peter | $226,497 |
Source: Public Records
Tax History Compared to Growth
Tax History
| Year | Tax Paid | Tax Assessment Tax Assessment Total Assessment is a certain percentage of the fair market value that is determined by local assessors to be the total taxable value of land and additions on the property. | Land | Improvement |
|---|---|---|---|---|
| 2025 | $7,106 | $236,700 | $117,700 | $119,000 |
| 2024 | $6,926 | $236,700 | $117,700 | $119,000 |
| 2023 | $6,926 | $236,700 | $117,700 | $119,000 |
| 2022 | $6,613 | $236,700 | $117,700 | $119,000 |
| 2021 | $6,613 | $236,700 | $117,700 | $119,000 |
| 2020 | $6,502 | $236,700 | $117,700 | $119,000 |
| 2019 | $6,312 | $229,600 | $116,500 | $113,100 |
| 2018 | $6,139 | $220,200 | $111,400 | $108,800 |
| 2017 | $5,900 | $207,900 | $113,400 | $94,500 |
| 2016 | $5,612 | $208,700 | $113,400 | $95,300 |
| 2015 | $5,412 | $196,600 | $108,400 | $88,200 |
| 2014 | $5,626 | $206,600 | $118,400 | $88,200 |
Source: Public Records
Map
Nearby Homes
- 110 E Shawnee Trail
- 33 Shawnee Pkwy
- 30 State Route 181
- 38 E Shawnee Trail
- 7 Shenandoah Crescent
- 31 Crescent Dr
- 8 Abbott Dr
- 27 Yacht Club Dr
- 32 Alpine Dr
- 9 Jessica Ct
- 148 New Jersey 181
- 59 Sachem Rd
- 00 Swan Ln
- 33 Shore Rd
- 17-19 Shore Rd
- 24 Shore Rd
- 00 Swan Boa Vista Dr
- 73 Edison Rd
- 6 Lorac Ln
- 680 New Jersey 15 Unit 60
- 7 Highview Trail
- 9 Highview Trail
- 5 Highview Trail
- 4 Highview Trail
- 3 Highview Trail
- 6 Highview Trail
- 16 Highview Terrace
- 14 Highview Terrace
- 8 Highview Trail
- 1 Highview Trail
- 18 Highview Terrace
- 13 Highview Trail
- 12 High View Terrace
- 20 Highview Terrace
- 9 Highview Terrace
- 11 Highview Terrace
- 10 Highview Trail
- 22 Highview Terrace
- 15 Highview Trail
- 22 High View Terrace