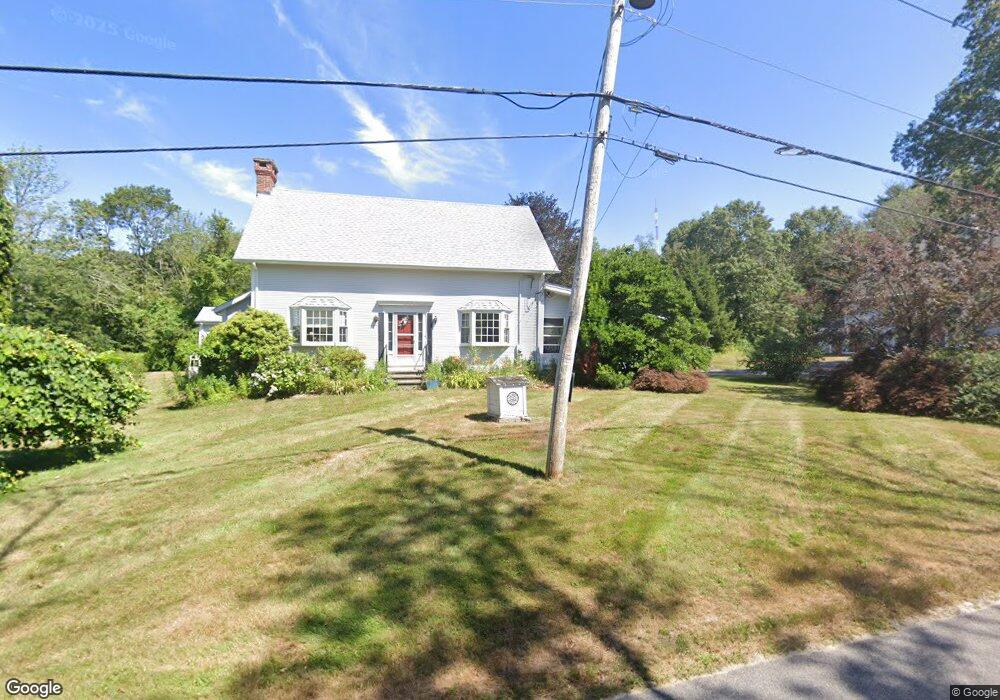
4 Hillside Ave Rehoboth, MA 02769
Rehoboth AreaEstimated Value: $718,000 - $791,000
About This Home
This home is located at 4 Hillside Ave, Rehoboth, MA 02769 and is currently estimated at $749,186, approximately $325 per square foot. 4 Hillside Ave is a home located in Bristol County with nearby schools including Dighton-Rehoboth Regional High School and Cedar Brook School.
Ownership History
We collect this data history from publicly available records. To have your information removed, we recommend requesting removal directly through your county’s website.
Purchase Details
Purchase Details
Home Values in the Area
Average Home Value in this Area
Purchase History
We collect this data history from publicly available records. To have your information removed, we recommend requesting removal directly through your county’s website.
| Date | Buyer | Sale Price | Title Company |
|---|---|---|---|
| -- | -- | ||
| $4,605 | -- |
Mortgage History
We collect this data history from publicly available records. To have your information removed, we recommend requesting removal directly through your county’s website.
| Date | Status | Borrower | Loan Amount |
|---|---|---|---|
| Previous Owner | $40,000 | ||
| Previous Owner | $40,000 |
Tax History
We collect this data history from publicly available records. To have your information removed, we recommend requesting removal directly through your county’s website.
| Year | Tax Paid | Tax Assessment Tax Assessment Total Assessment is a certain percentage of the fair market value that is determined by local assessors to be the total taxable value of land and additions on the property. | Land | Improvement |
|---|---|---|---|---|
| 2025 | $67 | $602,700 | $241,500 | $361,200 |
| 2024 | $6,669 | $587,100 | $241,500 | $345,600 |
| 2023 | $6,575 | $567,800 | $237,500 | $330,300 |
| 2022 | $5,864 | $462,800 | $229,100 | $233,700 |
| 2021 | $5,824 | $439,900 | $212,800 | $227,100 |
| 2020 | $5,513 | $420,200 | $212,800 | $207,400 |
| 2018 | $1,791 | $410,200 | $205,000 | $205,200 |
| 2017 | $5,152 | $410,200 | $205,000 | $205,200 |
| 2016 | $4,984 | $410,200 | $205,000 | $205,200 |
| 2015 | $4,821 | $391,600 | $197,800 | $193,800 |
| 2014 | $3,947 | $317,300 | $190,600 | $126,700 |
Map
- 12 Pine St
- 170 Rocky Hill Rd
- 112 Broad St
- 6 Running Stream Rd
- 390 Read St
- 46 Broad St
- 993 Pine St
- 39 Letendre Rd
- 139 Rocky Hill Rd
- 156 Rocky Hill Rd
- 24 Danforth St
- 285 Jacob St
- 380 Woodward Ave
- 12 Hidden Hills Dr
- 191 Fairway Dr
- 1096 Taunton Ave
- 241 Perryville Rd
- 224 Perryville Rd
- 275 Summer St
- 89 Walker St
Ask me questions while you tour the home.