Estimated Value: $453,940 - $486,000
4
Beds
3
Baths
2,150
Sq Ft
$220/Sq Ft
Est. Value
About This Home
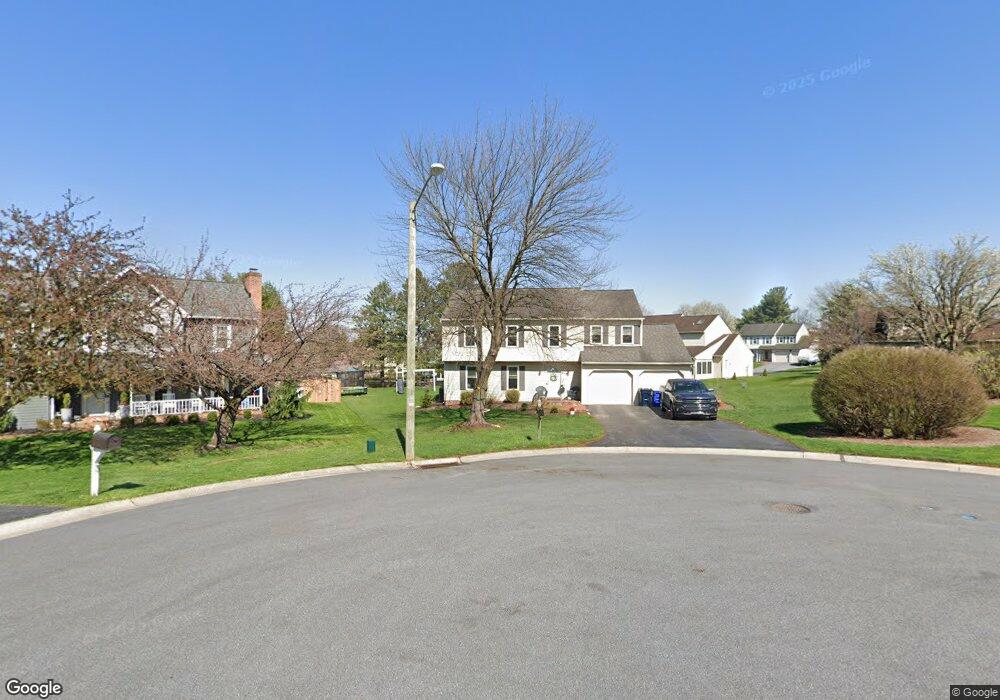
This home is located at 4 Hobson Ct, Leola, PA 17540 and is currently estimated at $473,985, approximately $220 per square foot. 4 Hobson Ct is a home with nearby schools including Brownstown El School, Gerald G. Huesken Middle School, and Conestoga Valley High School.
Ownership History
Date
Name
Owned For
Owner Type
Purchase Details
Closed on
Nov 6, 2020
Sold by
Knapik Stephen L and Knapik Cynthia J
Bought by
Umberger Justin M and Umberger Morgan
Current Estimated Value
Home Financials for this Owner
Home Financials are based on the most recent Mortgage that was taken out on this home.
Original Mortgage
$272,213
Outstanding Balance
$242,666
Interest Rate
2.9%
Mortgage Type
New Conventional
Estimated Equity
$231,319
Create a Home Valuation Report for This Property
The Home Valuation Report is an in-depth analysis detailing your home's value as well as a comparison with similar homes in the area
Home Values in the Area
Average Home Value in this Area
Purchase History
| Date | Buyer | Sale Price | Title Company |
|---|---|---|---|
| Umberger Justin M | $297,500 | Realty Settlement Svcs Inc |
Source: Public Records
Mortgage History
| Date | Status | Borrower | Loan Amount |
|---|---|---|---|
| Open | Umberger Justin M | $272,213 |
Source: Public Records
Tax History Compared to Growth
Tax History
| Year | Tax Paid | Tax Assessment Tax Assessment Total Assessment is a certain percentage of the fair market value that is determined by local assessors to be the total taxable value of land and additions on the property. | Land | Improvement |
|---|---|---|---|---|
| 2025 | $4,701 | $236,200 | $68,400 | $167,800 |
| 2024 | $4,701 | $236,200 | $68,400 | $167,800 |
| 2023 | $4,591 | $236,200 | $68,400 | $167,800 |
| 2022 | $4,405 | $236,200 | $68,400 | $167,800 |
| 2021 | $4,245 | $236,200 | $68,400 | $167,800 |
| 2020 | $4,245 | $236,200 | $68,400 | $167,800 |
| 2019 | $4,150 | $236,200 | $68,400 | $167,800 |
| 2018 | $6,135 | $236,200 | $68,400 | $167,800 |
| 2017 | $3,725 | $175,300 | $40,400 | $134,900 |
| 2016 | $3,725 | $175,300 | $40,400 | $134,900 |
| 2015 | $933 | $175,300 | $40,400 | $134,900 |
| 2014 | $2,504 | $175,300 | $40,400 | $134,900 |
Source: Public Records
Map
Nearby Homes