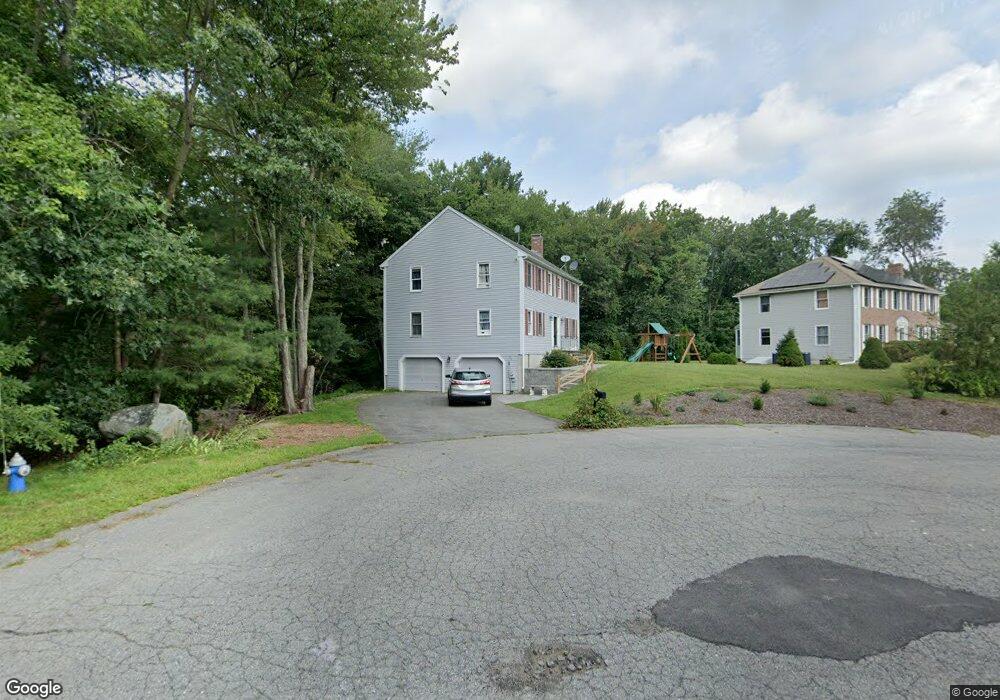
4 Holbrook St Medway, MA 02053
Estimated Value: $735,740 - $1,013,000
4
Beds
3
Baths
2,255
Sq Ft
$389/Sq Ft
Est. Value
About This Home
This home is located at 4 Holbrook St, Medway, MA 02053 and is currently estimated at $877,685, approximately $389 per square foot. 4 Holbrook St is a home located in Norfolk County with nearby schools including John D. McGovern Elementary School, Burke-Memorial Elementary, and Medway Middle School.
Ownership History
Date
Name
Owned For
Owner Type
Purchase Details
Closed on
Mar 10, 2017
Sold by
Lee Arthur R and Lee Christine M
Bought by
Lee Rt
Current Estimated Value
Purchase Details
Closed on
Feb 4, 1992
Sold by
Brookside Rt
Bought by
Lee Arthur R and Lee Christine M
Home Financials for this Owner
Home Financials are based on the most recent Mortgage that was taken out on this home.
Original Mortgage
$75,000
Interest Rate
8.44%
Mortgage Type
Purchase Money Mortgage
Create a Home Valuation Report for This Property
The Home Valuation Report is an in-depth analysis detailing your home's value as well as a comparison with similar homes in the area
Home Values in the Area
Average Home Value in this Area
Purchase History
| Date | Buyer | Sale Price | Title Company |
|---|---|---|---|
| Lee Rt | -- | -- | |
| Lee Arthur R | $179,000 | -- |
Source: Public Records
Mortgage History
| Date | Status | Borrower | Loan Amount |
|---|---|---|---|
| Previous Owner | Lee Arthur R | $112,000 | |
| Previous Owner | Lee Arthur R | $75,000 |
Source: Public Records
Tax History Compared to Growth
Tax History
| Year | Tax Paid | Tax Assessment Tax Assessment Total Assessment is a certain percentage of the fair market value that is determined by local assessors to be the total taxable value of land and additions on the property. | Land | Improvement |
|---|---|---|---|---|
| 2025 | $9,056 | $635,500 | $325,700 | $309,800 |
| 2024 | $9,151 | $635,500 | $325,700 | $309,800 |
| 2023 | $9,086 | $570,000 | $296,500 | $273,500 |
| 2022 | $8,059 | $476,000 | $219,200 | $256,800 |
| 2021 | $8,021 | $459,400 | $204,600 | $254,800 |
| 2020 | $7,861 | $449,200 | $204,600 | $244,600 |
| 2019 | $7,412 | $436,800 | $196,300 | $240,500 |
| 2018 | $7,493 | $424,300 | $187,900 | $236,400 |
| 2017 | $7,455 | $416,000 | $183,700 | $232,300 |
| 2016 | $6,809 | $376,000 | $143,700 | $232,300 |
| 2015 | $6,709 | $367,800 | $142,000 | $225,800 |
| 2014 | $6,436 | $341,600 | $142,000 | $199,600 |
Source: Public Records
Map
Nearby Homes
- 39 West St
- 9 Tulip Way
- 22 Granite St
- 6 Rainbow Dr
- 4 Deerfield Rd
- 0 Old Log Lane (Farm St) Unit 73416329
- 462 Hartford Ave
- 78 Fisher St
- 455 Hartford Ave
- 6 Freedom Trail
- 85 Fisher St
- 387 Hartford Ave
- 5 Fales St
- 220 Main St Unit 220
- 18 Mary Anne Dr
- 14 Hawthorne Village Unit D
- 176 Main St Unit 3
- 28 Wellington St
- 15 Broad Acres Farm Rd
- 21 Riverside Rd