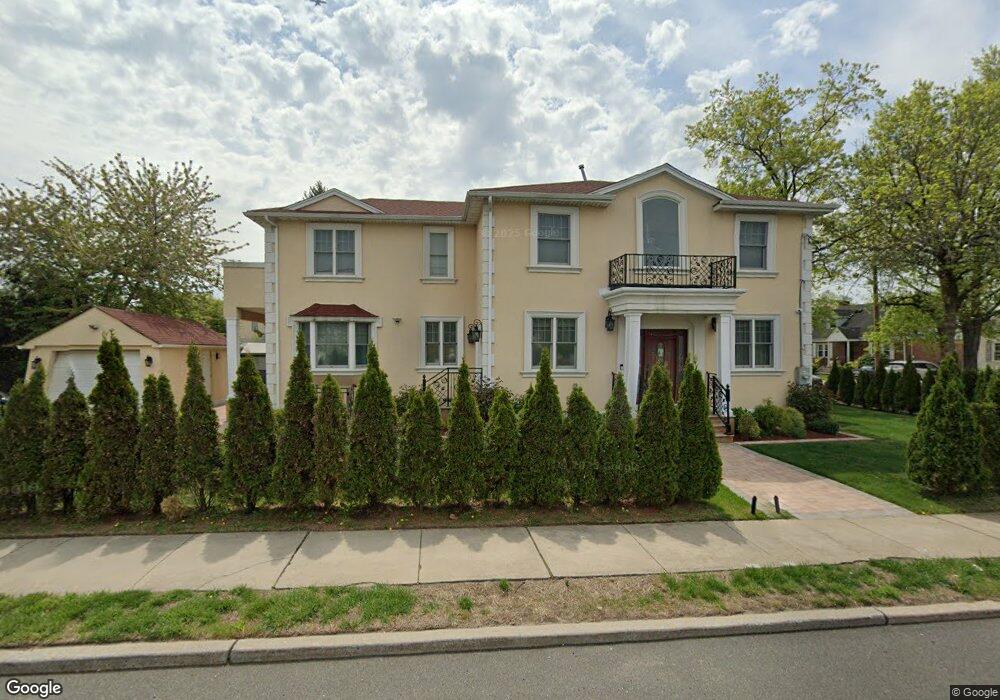
4 Hull Ave New Hyde Park, NY 11040
Estimated Value: $818,173 - $1,009,000
--
Bed
1
Bath
2,322
Sq Ft
$393/Sq Ft
Est. Value
About This Home
This home is located at 4 Hull Ave, New Hyde Park, NY 11040 and is currently estimated at $913,587, approximately $393 per square foot. 4 Hull Ave is a home located in Nassau County with nearby schools including Notre Dame School.
Ownership History
Date
Name
Owned For
Owner Type
Purchase Details
Closed on
Nov 10, 2014
Sold by
Gupta Jessie and Flores Felix X
Bought by
Gupta Jessie
Current Estimated Value
Purchase Details
Closed on
Jul 31, 2013
Sold by
Nykiel John J and Calderon Dee
Bought by
Gupta Jessie and Flores Felix X
Home Financials for this Owner
Home Financials are based on the most recent Mortgage that was taken out on this home.
Original Mortgage
$234,000
Outstanding Balance
$173,460
Interest Rate
4.31%
Estimated Equity
$740,127
Purchase Details
Closed on
Jun 17, 2002
Sold by
Nykiel Sophie
Purchase Details
Closed on
Sep 20, 2000
Create a Home Valuation Report for This Property
The Home Valuation Report is an in-depth analysis detailing your home's value as well as a comparison with similar homes in the area
Home Values in the Area
Average Home Value in this Area
Purchase History
| Date | Buyer | Sale Price | Title Company |
|---|---|---|---|
| Gupta Jessie | -- | None Available | |
| Gupta Jessie | -- | -- | |
| -- | -- | -- | |
| -- | -- | -- |
Source: Public Records
Mortgage History
| Date | Status | Borrower | Loan Amount |
|---|---|---|---|
| Open | Gupta Jessie | $234,000 |
Source: Public Records
Tax History Compared to Growth
Tax History
| Year | Tax Paid | Tax Assessment Tax Assessment Total Assessment is a certain percentage of the fair market value that is determined by local assessors to be the total taxable value of land and additions on the property. | Land | Improvement |
|---|---|---|---|---|
| 2025 | $10,320 | $638 | $205 | $433 |
| 2024 | $2,876 | $652 | $210 | $442 |
| 2023 | $8,297 | $672 | $216 | $456 |
| 2022 | $8,297 | $672 | $216 | $456 |
| 2021 | $6,772 | $543 | $318 | $225 |
| 2020 | $10,568 | $693 | $630 | $63 |
| 2019 | $9,855 | $743 | $633 | $110 |
| 2018 | $9,930 | $792 | $0 | $0 |
| 2017 | $7,136 | $863 | $675 | $188 |
| 2016 | $10,300 | $863 | $675 | $188 |
| 2015 | -- | $863 | $675 | $188 |
| 2014 | -- | $863 | $675 | $188 |
| 2013 | $2,862 | $863 | $675 | $188 |
Source: Public Records
Map
Nearby Homes