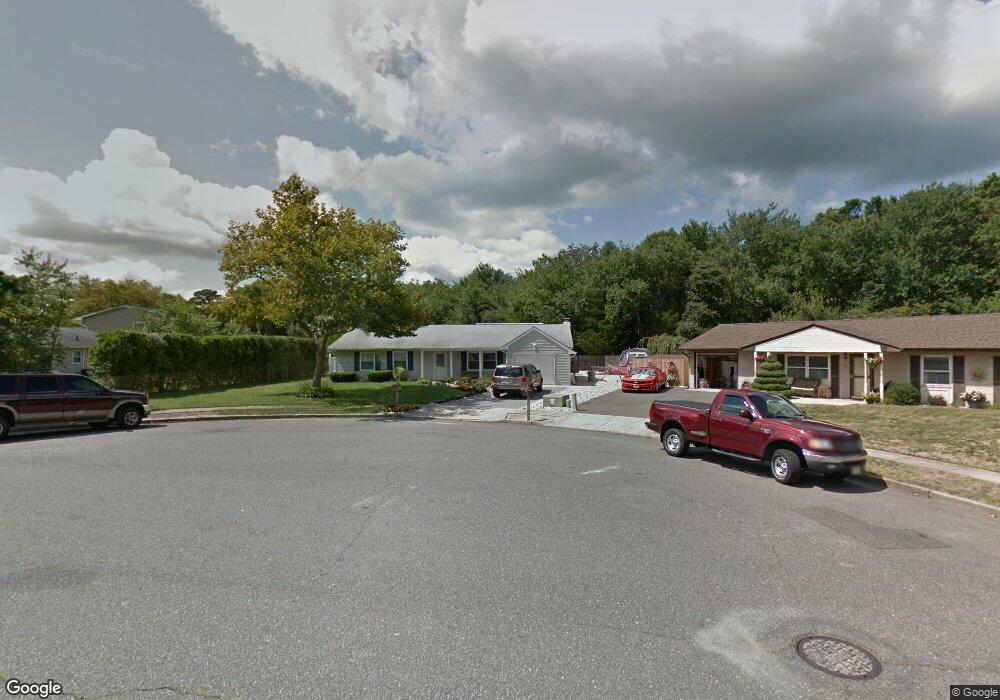
4 Iselin Ct Barnegat, NJ 08005
Barnegat Township NeighborhoodEstimated Value: $396,000 - $445,000
3
Beds
2
Baths
1,224
Sq Ft
$339/Sq Ft
Est. Value
About This Home
This home is located at 4 Iselin Ct, Barnegat, NJ 08005 and is currently estimated at $414,476, approximately $338 per square foot. 4 Iselin Ct is a home located in Ocean County with nearby schools including Barnegat High School.
Ownership History
Date
Name
Owned For
Owner Type
Purchase Details
Closed on
Jan 31, 2007
Sold by
Caraccio Steven and Sepp James
Bought by
Smith Angela
Current Estimated Value
Home Financials for this Owner
Home Financials are based on the most recent Mortgage that was taken out on this home.
Original Mortgage
$242,250
Outstanding Balance
$145,661
Interest Rate
6.23%
Mortgage Type
Purchase Money Mortgage
Estimated Equity
$268,815
Purchase Details
Closed on
Sep 12, 2006
Sold by
Thomas Helen
Bought by
Caraccio Steven and Sepp James
Create a Home Valuation Report for This Property
The Home Valuation Report is an in-depth analysis detailing your home's value as well as a comparison with similar homes in the area
Home Values in the Area
Average Home Value in this Area
Purchase History
| Date | Buyer | Sale Price | Title Company |
|---|---|---|---|
| Smith Angela | $255,000 | Coastline Title Agency Inc | |
| Caraccio Steven | $184,315 | None Available |
Source: Public Records
Mortgage History
| Date | Status | Borrower | Loan Amount |
|---|---|---|---|
| Open | Smith Angela | $242,250 |
Source: Public Records
Tax History Compared to Growth
Tax History
| Year | Tax Paid | Tax Assessment Tax Assessment Total Assessment is a certain percentage of the fair market value that is determined by local assessors to be the total taxable value of land and additions on the property. | Land | Improvement |
|---|---|---|---|---|
| 2025 | $5,883 | $197,600 | $105,500 | $92,100 |
| 2024 | $5,752 | $197,600 | $105,500 | $92,100 |
| 2023 | $5,566 | $197,600 | $105,500 | $92,100 |
| 2022 | $5,566 | $197,600 | $105,500 | $92,100 |
| 2021 | $5,541 | $197,600 | $105,500 | $92,100 |
| 2020 | $5,515 | $197,600 | $105,500 | $92,100 |
| 2019 | $5,434 | $197,600 | $105,500 | $92,100 |
| 2018 | $5,393 | $197,600 | $105,500 | $92,100 |
| 2017 | $5,304 | $197,600 | $105,500 | $92,100 |
| 2016 | $5,195 | $197,600 | $105,500 | $92,100 |
| 2015 | $5,031 | $192,200 | $105,500 | $86,700 |
| 2014 | $4,768 | $192,200 | $105,500 | $86,700 |
Source: Public Records
Map
Nearby Homes