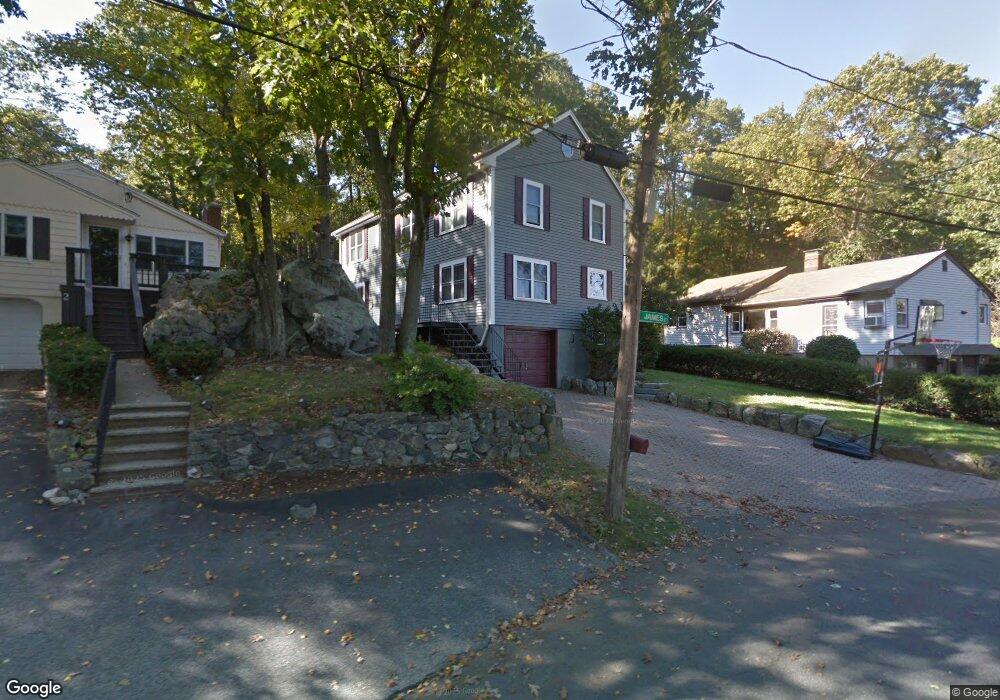
4 James St Winchester, MA 01890
West Side NeighborhoodEstimated Value: $965,000 - $1,319,000
4
Beds
4
Baths
2,016
Sq Ft
$559/Sq Ft
Est. Value
About This Home
This home is located at 4 James St, Winchester, MA 01890 and is currently estimated at $1,127,763, approximately $559 per square foot. 4 James St is a home located in Middlesex County with nearby schools including Vinson-Owen Elementary School, McCall Middle School, and Winchester High School.
Ownership History
Date
Name
Owned For
Owner Type
Purchase Details
Closed on
Apr 27, 2017
Sold by
Mackay 3Rd Allan H and Mackay Barbara J
Bought by
Mackay Ft
Current Estimated Value
Purchase Details
Closed on
Jul 30, 1996
Sold by
Struthers William D and Struthers Karen J
Bought by
Mackay Allan and Mackay Barabra
Home Financials for this Owner
Home Financials are based on the most recent Mortgage that was taken out on this home.
Original Mortgage
$143,200
Interest Rate
8.37%
Mortgage Type
Purchase Money Mortgage
Create a Home Valuation Report for This Property
The Home Valuation Report is an in-depth analysis detailing your home's value as well as a comparison with similar homes in the area
Home Values in the Area
Average Home Value in this Area
Purchase History
| Date | Buyer | Sale Price | Title Company |
|---|---|---|---|
| Mackay Ft | -- | -- | |
| Mackay Allan | $179,000 | -- |
Source: Public Records
Mortgage History
| Date | Status | Borrower | Loan Amount |
|---|---|---|---|
| Previous Owner | Mackay Allan | $143,200 |
Source: Public Records
Tax History
| Year | Tax Paid | Tax Assessment Tax Assessment Total Assessment is a certain percentage of the fair market value that is determined by local assessors to be the total taxable value of land and additions on the property. | Land | Improvement |
|---|---|---|---|---|
| 2025 | $119 | $1,070,000 | $624,100 | $445,900 |
| 2024 | $11,767 | $1,038,600 | $624,100 | $414,500 |
| 2023 | $11,566 | $980,200 | $572,100 | $408,100 |
| 2022 | $10,271 | $821,000 | $433,400 | $387,600 |
| 2021 | $5,032 | $812,300 | $424,700 | $387,600 |
| 2020 | $19,778 | $812,300 | $424,700 | $387,600 |
| 2019 | $8,998 | $743,000 | $355,400 | $387,600 |
| 2018 | $4,748 | $715,300 | $338,000 | $377,300 |
| 2017 | $8,320 | $677,500 | $320,700 | $356,800 |
| 2016 | $7,793 | $667,200 | $320,700 | $346,500 |
| 2015 | $7,583 | $624,600 | $290,400 | $334,200 |
| 2014 | $7,282 | $575,200 | $251,400 | $323,800 |
Source: Public Records
Map
Nearby Homes
Your Personal Tour Guide
Ask me questions while you tour the home.