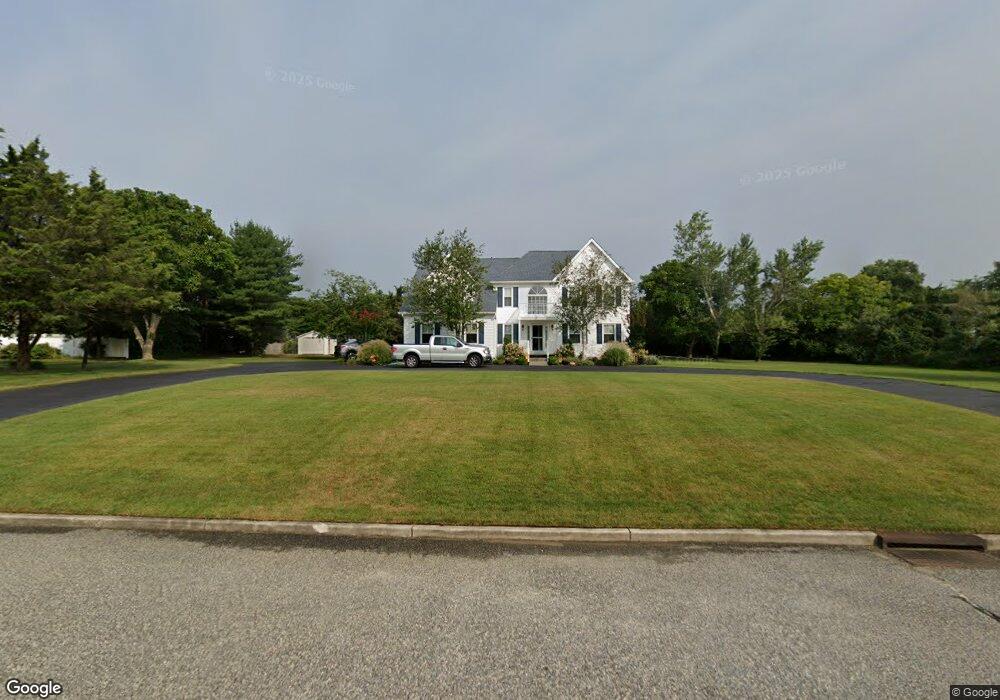
4 Jason Dr Ocean View, NJ 08230
Estimated Value: $663,506 - $753,000
--
Bed
--
Bath
2,500
Sq Ft
$286/Sq Ft
Est. Value
About This Home
This home is located at 4 Jason Dr, Ocean View, NJ 08230 and is currently estimated at $715,127, approximately $286 per square foot. 4 Jason Dr is a home located in Cape May County with nearby schools including Upper Township Primary School, Upper Township Elementary School, and Upper Township Middle School.
Ownership History
Date
Name
Owned For
Owner Type
Purchase Details
Closed on
Jul 3, 2024
Sold by
Larosa John E and Larosa Suzan G
Bought by
Larosa John E and Larosa Suzan G
Current Estimated Value
Purchase Details
Closed on
Aug 1, 2018
Sold by
Larosa John E and Larosa Suzan G
Bought by
Larosa John E and Larosa Suzan G
Purchase Details
Closed on
Aug 20, 1998
Sold by
Thompson Lynn
Bought by
Larosa Susan and Larosa John
Home Financials for this Owner
Home Financials are based on the most recent Mortgage that was taken out on this home.
Original Mortgage
$1,125,000
Interest Rate
6.9%
Create a Home Valuation Report for This Property
The Home Valuation Report is an in-depth analysis detailing your home's value as well as a comparison with similar homes in the area
Home Values in the Area
Average Home Value in this Area
Purchase History
| Date | Buyer | Sale Price | Title Company |
|---|---|---|---|
| Larosa John E | -- | None Listed On Document | |
| Larosa John E | -- | -- | |
| Larosa John E | -- | -- | |
| Larosa John E | -- | -- | |
| Larosa John E | -- | -- | |
| Larosa John E | -- | -- | |
| Larosa John E | -- | -- | |
| Larosa Susan | $255,000 | -- |
Source: Public Records
Mortgage History
| Date | Status | Borrower | Loan Amount |
|---|---|---|---|
| Previous Owner | Larosa Susan | $1,125,000 |
Source: Public Records
Tax History Compared to Growth
Tax History
| Year | Tax Paid | Tax Assessment Tax Assessment Total Assessment is a certain percentage of the fair market value that is determined by local assessors to be the total taxable value of land and additions on the property. | Land | Improvement |
|---|---|---|---|---|
| 2025 | $10,022 | $436,700 | $162,600 | $274,100 |
| 2024 | $10,022 | $436,700 | $162,600 | $274,100 |
| 2023 | $9,529 | $436,700 | $162,600 | $274,100 |
| 2022 | $9,210 | $436,700 | $162,600 | $274,100 |
| 2021 | $6,581 | $436,700 | $162,600 | $274,100 |
| 2020 | $8,408 | $429,400 | $162,600 | $266,800 |
| 2019 | $8,206 | $429,400 | $162,600 | $266,800 |
| 2018 | $7,995 | $429,400 | $162,600 | $266,800 |
| 2017 | $7,905 | $429,400 | $162,600 | $266,800 |
| 2016 | $8,030 | $429,400 | $162,600 | $266,800 |
| 2015 | $7,819 | $429,400 | $162,600 | $266,800 |
| 2014 | $6,531 | $439,200 | $182,400 | $256,800 |
Source: Public Records
Map
Nearby Homes
- 1340 U S 9
- 1729 Shore Rd
- 4 Sandcastle Dr
- 1731 Route 9 Unit 28
- 3 Sandcastle Dr
- 1233 Route 9
- 28 Queen Anne Ct
- 40 Butter Rd
- 1431 Stagecoach Rd
- 124 Butter Rd
- 11 Red Oak Dr
- 49 Hope Corson Rd
- 127 Route 50
- 4 Bayview Ave
- 100 Bayview Ave
- 19 Bayview Ave
- 4 W Katherine Ave
- 46 Victoria Ln
- 86 Route 50
- 10 New Jersey 50