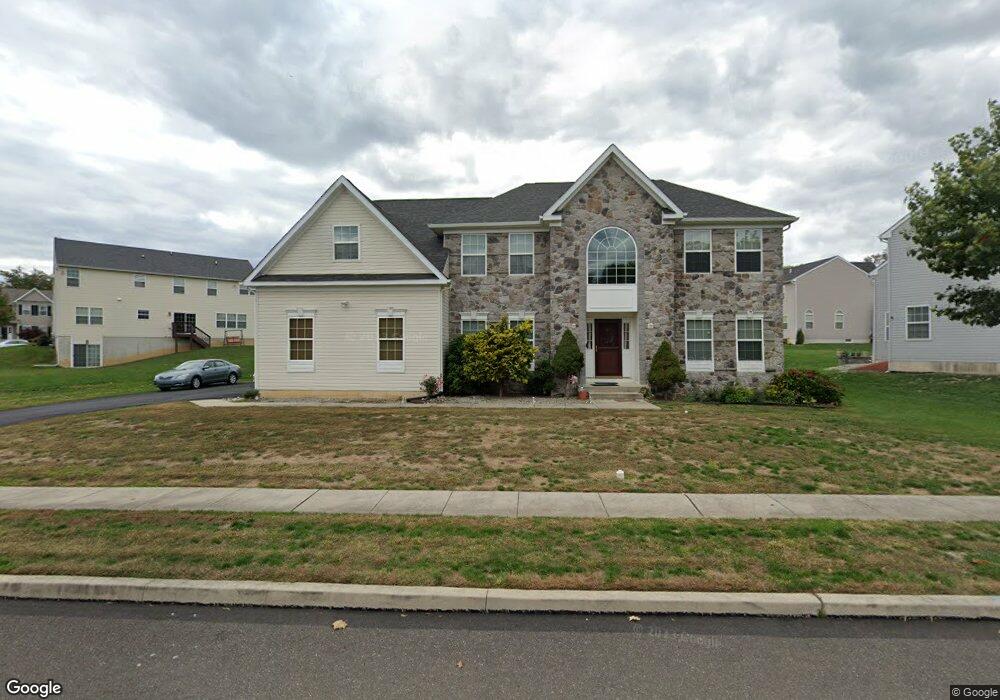
4 Java Ln Langhorne, PA 19047
Estimated Value: $678,000 - $833,000
4
Beds
3
Baths
3,136
Sq Ft
$241/Sq Ft
Est. Value
About This Home
This home is located at 4 Java Ln, Langhorne, PA 19047 and is currently estimated at $757,081, approximately $241 per square foot. 4 Java Ln is a home located in Bucks County with nearby schools including Albert Schweitzer Elementary School, Sandburg Middle School, and Neshaminy High School.
Ownership History
Date
Name
Owned For
Owner Type
Purchase Details
Closed on
Dec 11, 2008
Sold by
Durham Manor Llc
Bought by
Sampat Neal J and Sampat Nital N
Current Estimated Value
Home Financials for this Owner
Home Financials are based on the most recent Mortgage that was taken out on this home.
Original Mortgage
$396,250
Outstanding Balance
$263,606
Interest Rate
6.27%
Mortgage Type
Purchase Money Mortgage
Estimated Equity
$493,475
Create a Home Valuation Report for This Property
The Home Valuation Report is an in-depth analysis detailing your home's value as well as a comparison with similar homes in the area
Home Values in the Area
Average Home Value in this Area
Purchase History
| Date | Buyer | Sale Price | Title Company |
|---|---|---|---|
| Sampat Neal J | $495,320 | None Available |
Source: Public Records
Mortgage History
| Date | Status | Borrower | Loan Amount |
|---|---|---|---|
| Open | Sampat Neal J | $396,250 |
Source: Public Records
Tax History
| Year | Tax Paid | Tax Assessment Tax Assessment Total Assessment is a certain percentage of the fair market value that is determined by local assessors to be the total taxable value of land and additions on the property. | Land | Improvement |
|---|---|---|---|---|
| 2025 | $10,254 | $47,100 | $5,100 | $42,000 |
| 2024 | $10,254 | $47,100 | $5,100 | $42,000 |
| 2023 | $10,091 | $47,100 | $5,100 | $42,000 |
| 2022 | $9,826 | $47,100 | $5,100 | $42,000 |
| 2021 | $9,826 | $47,100 | $5,100 | $42,000 |
| 2020 | $9,708 | $47,100 | $5,100 | $42,000 |
| 2019 | $9,492 | $47,100 | $5,100 | $42,000 |
| 2018 | $9,317 | $47,100 | $5,100 | $42,000 |
| 2017 | $9,079 | $47,100 | $5,100 | $42,000 |
| 2016 | $9,079 | $47,100 | $5,100 | $42,000 |
| 2015 | $9,269 | $47,100 | $5,100 | $42,000 |
| 2014 | $9,269 | $47,100 | $5,100 | $42,000 |
Source: Public Records
Map
Nearby Homes
- 51 Hollybrooke Dr
- 27 Spicebush Rd
- L:070 Trenton Rd
- 29 Spindletree Rd
- 301 Snowball Dr
- 0 Fir Ave
- 80 Silverspruce Rd
- 283 Snowball Dr
- 164 Trenton Rd
- 0 Main St
- 301 Main St
- 5 June Rd
- 24 Rose Apple Rd
- 711 Bellevue Ave
- 927 Bellevue Ave
- 18 Jump Hill Rd
- 440 Durham Rd
- 6343 Craig Ave
- 43 Petunia Rd
- 46 Hydrangea Rd