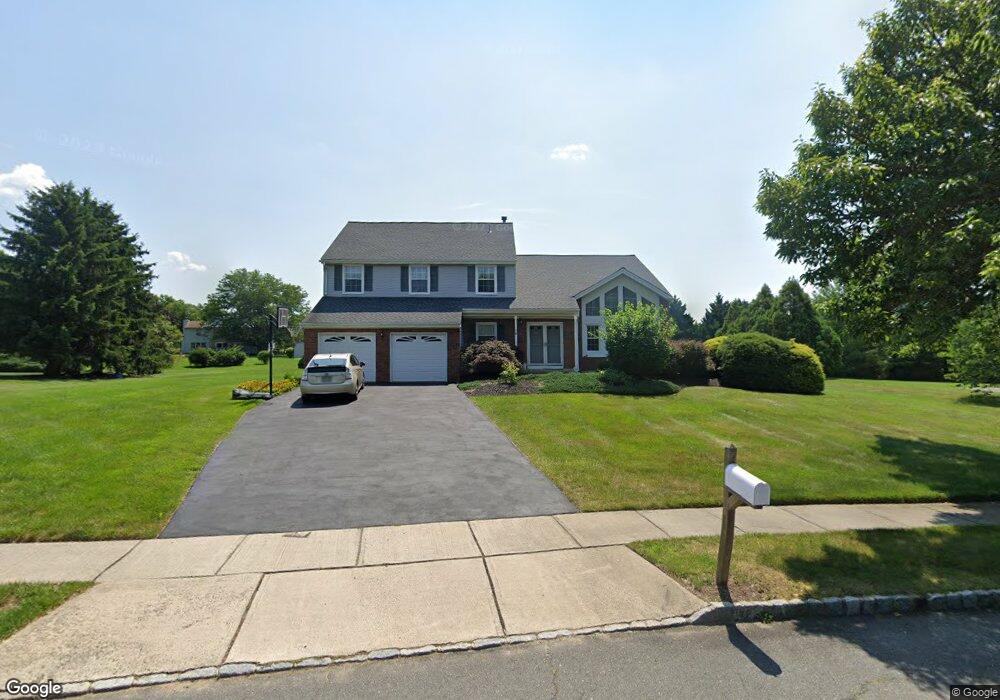
4 Jean Ct Princeton Junction, NJ 08550
Estimated Value: $1,019,000 - $1,102,000
Studio
--
Bath
2,642
Sq Ft
$405/Sq Ft
Est. Value
About This Home
This home is located at 4 Jean Ct, Princeton Junction, NJ 08550 and is currently estimated at $1,071,179, approximately $405 per square foot. 4 Jean Ct is a home located in Mercer County with nearby schools including Maurice Hawk Elementary School, Millstone River School, and Community Middle School.
Ownership History
Date
Name
Owned For
Owner Type
Purchase Details
Closed on
Mar 30, 2006
Sold by
Nimomiya Shogo
Bought by
Kong Steven and Kong Jennifer
Current Estimated Value
Home Financials for this Owner
Home Financials are based on the most recent Mortgage that was taken out on this home.
Original Mortgage
$200,000
Outstanding Balance
$114,999
Interest Rate
6.37%
Mortgage Type
Purchase Money Mortgage
Estimated Equity
$956,180
Purchase Details
Closed on
Jul 7, 1997
Sold by
Fitzgerald David
Bought by
Nimomiya Shogo
Purchase Details
Closed on
Jul 21, 1989
Sold by
Calton Homes Inc
Bought by
Fitzgerald David W and Fitzgerald Vanessa L
Create a Home Valuation Report for This Property
The Home Valuation Report is an in-depth analysis detailing your home's value as well as a comparison with similar homes in the area
Home Values in the Area
Average Home Value in this Area
Purchase History
| Date | Buyer | Sale Price | Title Company |
|---|---|---|---|
| Kong Steven | $700,000 | -- | |
| Nimomiya Shogo | $301,000 | -- | |
| Fitzgerald David W | $268,800 | -- |
Source: Public Records
Mortgage History
| Date | Status | Borrower | Loan Amount |
|---|---|---|---|
| Open | Kong Steven | $200,000 |
Source: Public Records
Tax History
| Year | Tax Paid | Tax Assessment Tax Assessment Total Assessment is a certain percentage of the fair market value that is determined by local assessors to be the total taxable value of land and additions on the property. | Land | Improvement |
|---|---|---|---|---|
| 2025 | $18,752 | $611,800 | $262,500 | $365,000 |
| 2024 | $17,969 | $611,800 | $262,500 | $365,000 |
Source: Public Records
Map
Nearby Homes
- 7 Camas Ct
- 2 Colonial Ct
- 11 Harvest Dr
- 42 Nassau Place
- Downeaster Plan at Townes at West Windsor
- Endeavor Plan at Townes at West Windsor
- Beneteau Plan at Townes at West Windsor
- Cape Dory Plan at Townes at West Windsor
- Alberg Plan at Townes at West Windsor
- 9 Howard Dr
- 17 Yeger Rd
- 12 Ziff Ln
- 12 Ziff La
- 3801 Jordan Dr
- 3704 Jordan Dr Unit 3701
- 3 Princeton Place
- 3 Beechtree Ln
- 34 Brians Cir
- 31 Cooper Ct
- 11 Cooper Ct
Your Personal Tour Guide
Ask me questions while you tour the home.