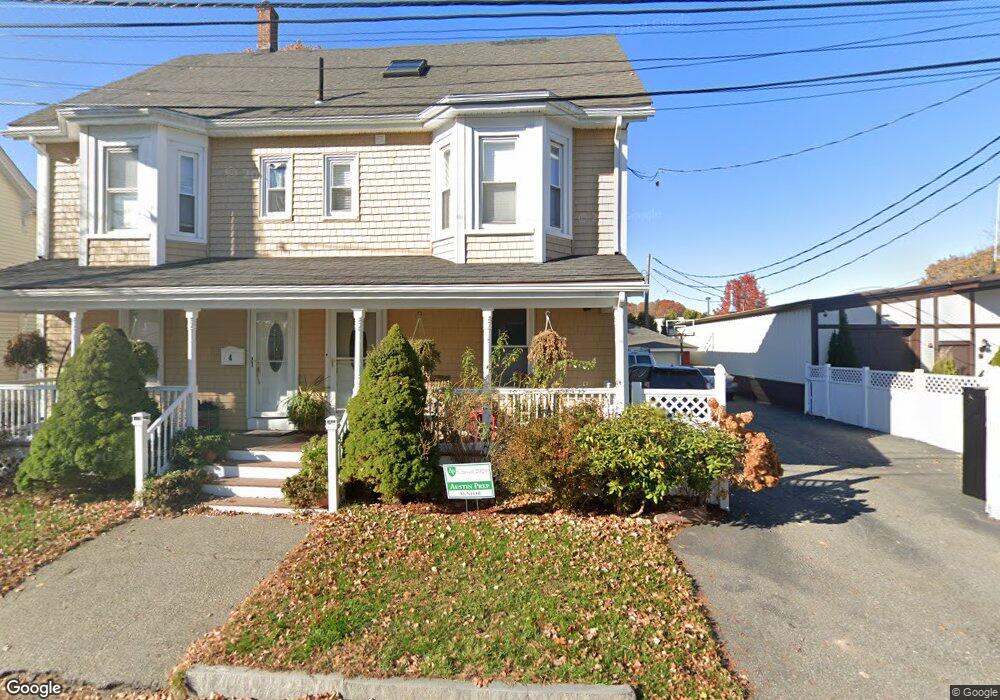
4 John St Woburn, MA 01801
Downtown Woburn NeighborhoodEstimated Value: $831,267 - $941,000
8
Beds
2
Baths
2,844
Sq Ft
$314/Sq Ft
Est. Value
About This Home
This home is located at 4 John St, Woburn, MA 01801 and is currently estimated at $893,567, approximately $314 per square foot. 4 John St is a home located in Middlesex County with nearby schools including Goodyear Elementary School, Daniel L. Joyce Middle School, and Woburn High School.
Ownership History
Date
Name
Owned For
Owner Type
Purchase Details
Closed on
Dec 31, 2003
Sold by
Mary Monique Jean
Bought by
Azor Mario and Azor Monique
Current Estimated Value
Home Financials for this Owner
Home Financials are based on the most recent Mortgage that was taken out on this home.
Original Mortgage
$274,000
Outstanding Balance
$127,783
Interest Rate
5.86%
Estimated Equity
$765,784
Create a Home Valuation Report for This Property
The Home Valuation Report is an in-depth analysis detailing your home's value as well as a comparison with similar homes in the area
Home Values in the Area
Average Home Value in this Area
Purchase History
| Date | Buyer | Sale Price | Title Company |
|---|---|---|---|
| Azor Mario | -- | -- | |
| Azor Mario | -- | -- |
Source: Public Records
Mortgage History
| Date | Status | Borrower | Loan Amount |
|---|---|---|---|
| Open | Azor Mario | $274,000 | |
| Closed | Azor Mario | $274,000 |
Source: Public Records
Tax History Compared to Growth
Tax History
| Year | Tax Paid | Tax Assessment Tax Assessment Total Assessment is a certain percentage of the fair market value that is determined by local assessors to be the total taxable value of land and additions on the property. | Land | Improvement |
|---|---|---|---|---|
| 2025 | $5,684 | $665,600 | $265,400 | $400,200 |
| 2024 | $5,179 | $642,500 | $252,700 | $389,800 |
| 2023 | $5,247 | $603,100 | $229,800 | $373,300 |
| 2022 | $5,160 | $552,500 | $199,800 | $352,700 |
| 2021 | $5,065 | $542,900 | $190,300 | $352,600 |
| 2020 | $5,902 | $491,400 | $190,300 | $301,100 |
| 2019 | $5,559 | $453,400 | $181,200 | $272,200 |
| 2018 | $4,288 | $433,600 | $166,300 | $267,300 |
| 2017 | $4,778 | $374,100 | $158,400 | $215,700 |
| 2016 | $3,510 | $349,300 | $148,000 | $201,300 |
| 2015 | $3,454 | $339,600 | $138,300 | $201,300 |
| 2014 | $3,481 | $333,400 | $138,300 | $195,100 |
Source: Public Records
Map
Nearby Homes
- 14 Ash St
- 44 Main St
- 61 Mount Pleasant St
- 14 Cross St
- 15 Sturgis St
- 64 Garfield Ave
- 35 Prospect St Unit 215
- 35 Prospect St Unit 204
- 39 Garfield Ave
- 29 Arlington Rd Unit 4
- 27 Arlington Rd Unit 1-6
- 69 Eastern Ave
- 31 Arlington Rd Unit 1-6
- 7 Prospect St
- 18 Beacon St Unit 18
- 52 Pleasant St
- 62 Jefferson Ave
- 2 George Rd Unit 2
- 149 Horn Pond Brook Rd
- 29 Shepard Ct