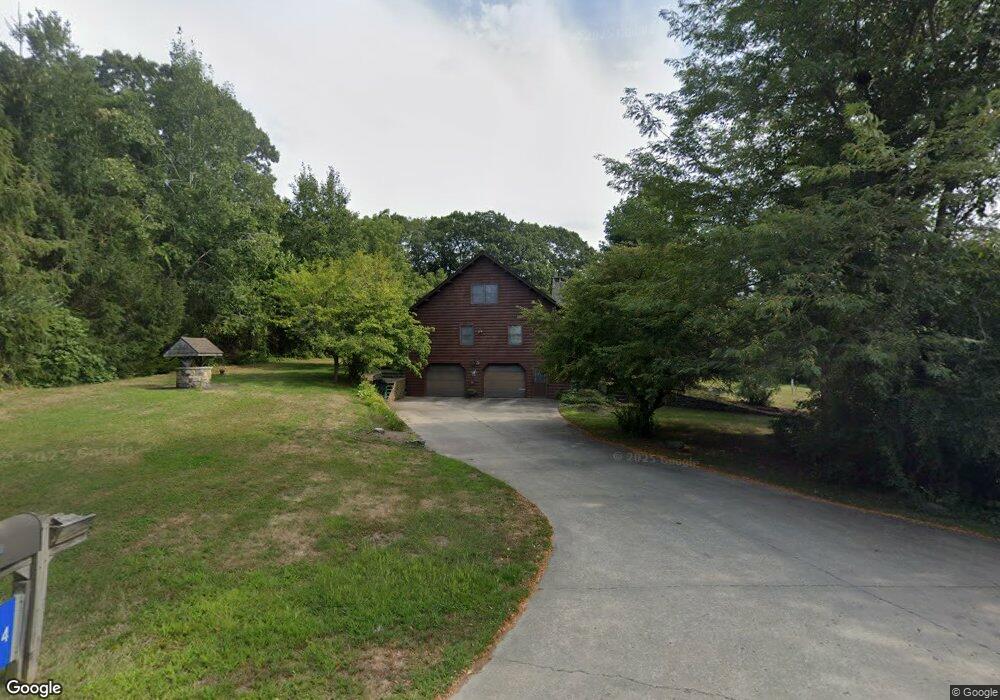
4 Karens Way Berkley, MA 02779
Estimated Value: $691,000 - $789,000
3
Beds
2
Baths
2,190
Sq Ft
$338/Sq Ft
Est. Value
About This Home
This home is located at 4 Karens Way, Berkley, MA 02779 and is currently estimated at $739,394, approximately $337 per square foot. 4 Karens Way is a home located in Bristol County with nearby schools including Berkley Community School and Our Lady of Lourdes School.
Ownership History
Date
Name
Owned For
Owner Type
Purchase Details
Closed on
Dec 9, 2010
Sold by
Fnma
Bought by
Chenard Kevin R
Current Estimated Value
Home Financials for this Owner
Home Financials are based on the most recent Mortgage that was taken out on this home.
Original Mortgage
$220,000
Outstanding Balance
$144,931
Interest Rate
4.24%
Mortgage Type
Purchase Money Mortgage
Estimated Equity
$594,463
Purchase Details
Closed on
Jun 7, 2010
Sold by
Droukas Todd C
Bought by
Federal National Mortgage Association
Purchase Details
Closed on
Jun 5, 2006
Sold by
Deangelo John E and Deangelo Mary
Bought by
Droukas Leahanne K and Droukas Todd C
Home Financials for this Owner
Home Financials are based on the most recent Mortgage that was taken out on this home.
Original Mortgage
$325,000
Interest Rate
6.55%
Mortgage Type
Purchase Money Mortgage
Create a Home Valuation Report for This Property
The Home Valuation Report is an in-depth analysis detailing your home's value as well as a comparison with similar homes in the area
Home Values in the Area
Average Home Value in this Area
Purchase History
| Date | Buyer | Sale Price | Title Company |
|---|---|---|---|
| Chenard Kevin R | $295,000 | -- | |
| Federal National Mortgage Association | $376,101 | -- | |
| Droukas Leahanne K | $452,900 | -- |
Source: Public Records
Mortgage History
| Date | Status | Borrower | Loan Amount |
|---|---|---|---|
| Open | Chenard Kevin R | $220,000 | |
| Previous Owner | Droukas Leahanne K | $325,000 |
Source: Public Records
Tax History Compared to Growth
Tax History
| Year | Tax Paid | Tax Assessment Tax Assessment Total Assessment is a certain percentage of the fair market value that is determined by local assessors to be the total taxable value of land and additions on the property. | Land | Improvement |
|---|---|---|---|---|
| 2025 | $78 | $649,400 | $158,000 | $491,400 |
| 2024 | $7,182 | $576,900 | $102,000 | $474,900 |
| 2023 | $6,708 | $507,400 | $96,600 | $410,800 |
| 2022 | $6,563 | $477,300 | $96,600 | $380,700 |
| 2021 | $6,437 | $450,800 | $96,600 | $354,200 |
| 2020 | $6,631 | $456,400 | $105,800 | $350,600 |
| 2019 | $6,458 | $441,100 | $108,000 | $333,100 |
| 2018 | $5,967 | $425,600 | $108,000 | $317,600 |
| 2017 | $5,859 | $409,700 | $127,700 | $282,000 |
| 2016 | $5,641 | $380,100 | $127,700 | $252,400 |
| 2015 | $5,015 | $360,500 | $127,700 | $232,800 |
| 2014 | $4,618 | $360,500 | $127,700 | $232,800 |
Source: Public Records
Map
Nearby Homes