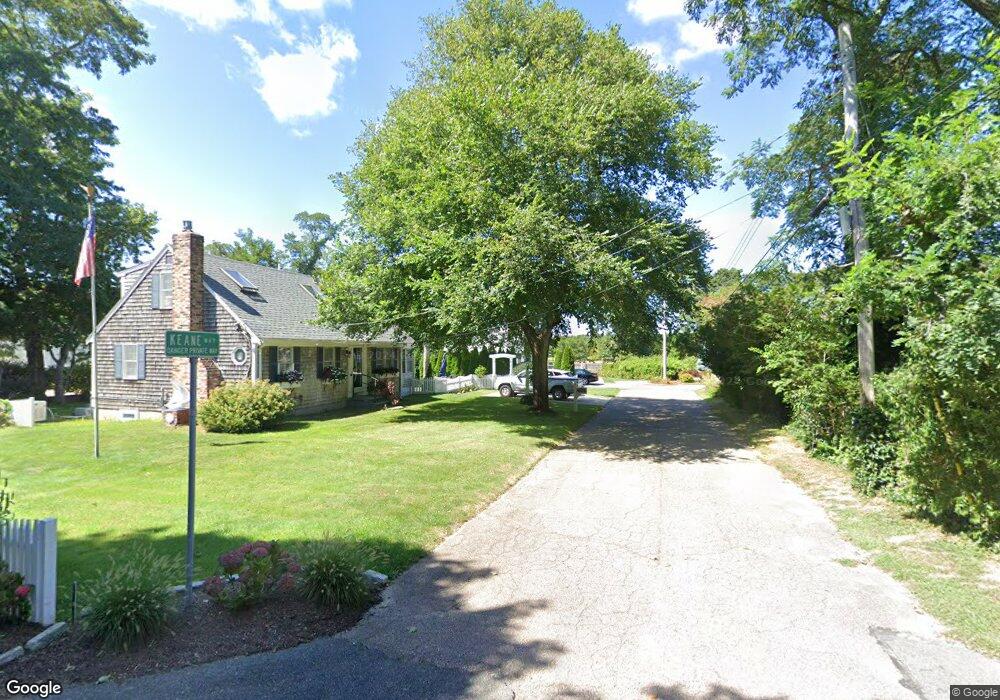
4 Keane Way Harwich Port, MA 02646
Harwich Port NeighborhoodEstimated Value: $765,000 - $955,000
4
Beds
2
Baths
1,201
Sq Ft
$732/Sq Ft
Est. Value
About This Home
This home is located at 4 Keane Way, Harwich Port, MA 02646 and is currently estimated at $879,554, approximately $732 per square foot. 4 Keane Way is a home located in Barnstable County with nearby schools including Harwich Elementary School, Chatham Elementary School, and Monomoy Regional Middle School.
Ownership History
Date
Name
Owned For
Owner Type
Purchase Details
Closed on
Feb 13, 2019
Sold by
Sullivan Timothy and Sullivan Joan F
Bought by
Sullivan Timothy
Current Estimated Value
Purchase Details
Closed on
Oct 15, 2013
Sold by
Sullivan Timothy
Bought by
Sullivan Timothy and Sullivan Joan F
Purchase Details
Closed on
Aug 1, 1997
Sold by
Cameron Paul L and Cameron Patrick D
Bought by
Sullivan Timothy
Home Financials for this Owner
Home Financials are based on the most recent Mortgage that was taken out on this home.
Original Mortgage
$101,250
Interest Rate
7.55%
Mortgage Type
Purchase Money Mortgage
Create a Home Valuation Report for This Property
The Home Valuation Report is an in-depth analysis detailing your home's value as well as a comparison with similar homes in the area
Home Values in the Area
Average Home Value in this Area
Purchase History
| Date | Buyer | Sale Price | Title Company |
|---|---|---|---|
| Sullivan Timothy | -- | -- | |
| Sullivan Timothy | -- | -- | |
| Sullivan Timothy | $135,000 | -- |
Source: Public Records
Mortgage History
| Date | Status | Borrower | Loan Amount |
|---|---|---|---|
| Previous Owner | Sullivan Timothy | $101,250 |
Source: Public Records
Tax History Compared to Growth
Tax History
| Year | Tax Paid | Tax Assessment Tax Assessment Total Assessment is a certain percentage of the fair market value that is determined by local assessors to be the total taxable value of land and additions on the property. | Land | Improvement |
|---|---|---|---|---|
| 2025 | $4,423 | $748,400 | $442,600 | $305,800 |
| 2024 | $4,281 | $709,900 | $417,500 | $292,400 |
| 2023 | $4,191 | $631,200 | $379,600 | $251,600 |
| 2022 | $4,232 | $521,800 | $330,100 | $191,700 |
| 2021 | $4,058 | $471,900 | $300,100 | $171,800 |
| 2020 | $3,894 | $446,100 | $279,200 | $166,900 |
| 2019 | $3,744 | $431,800 | $268,300 | $163,500 |
| 2018 | $3,614 | $398,700 | $243,900 | $154,800 |
| 2017 | $3,402 | $379,300 | $227,100 | $152,200 |
| 2016 | $3,366 | $371,100 | $227,100 | $144,000 |
| 2015 | $3,253 | $362,600 | $222,700 | $139,900 |
| 2014 | $3,101 | $353,600 | $216,000 | $137,600 |
Source: Public Records
Map
Nearby Homes
- 15 Pleasant St Unit W24
- 515 Route 28
- 515 Massachusetts 28
- 9 Jason Ln
- 53 Freeman St
- 23 Zylpha Rd
- 405 Lower County Rd Unit 21
- 405 Lower County Rd Unit 23
- 8 Wyndemere Bluffs Rd
- 135 Sisson Rd
- 292 Massachusetts 28 Unit 1
- 292 Massachusetts 28 Unit 7
- 297 Massachusetts 28
- 297 Massachusetts 28 Unit 1
- 16 Mirasol Ln
- 15 Shannon Rd
- 303 Bank St
- 18 Old Campground
- 12 Old Campground Rd
- 292 Route 28 Unit 7