Estimated Value: $414,755 - $567,000
--
Bed
--
Bath
2,559
Sq Ft
$193/Sq Ft
Est. Value
About This Home
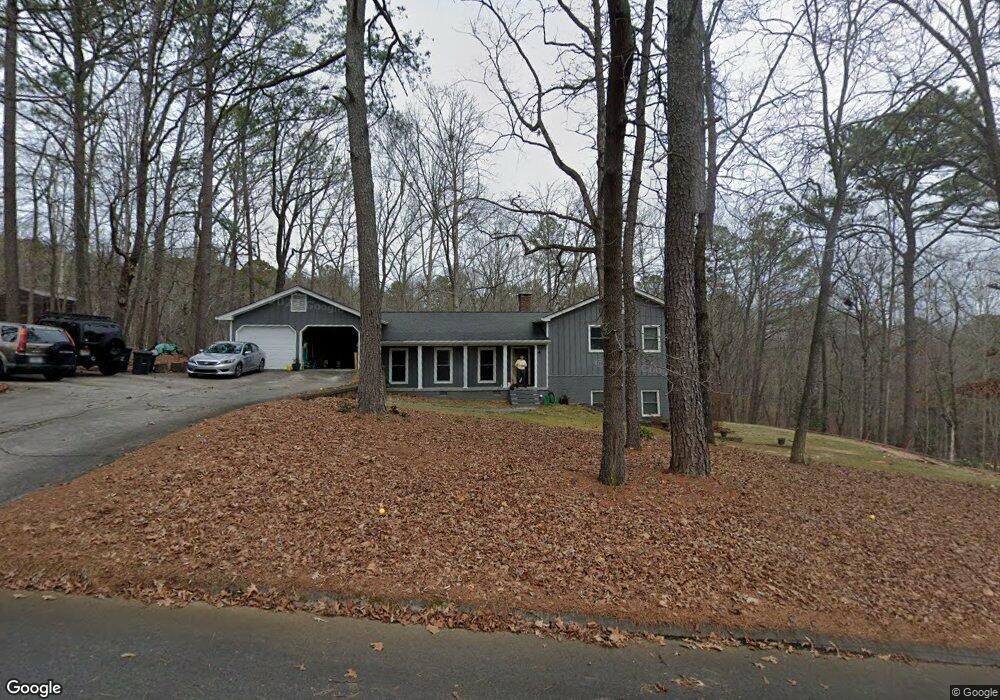
This home is located at 4 Kensington Rd SW, Rome, GA 30165 and is currently estimated at $493,689, approximately $192 per square foot. 4 Kensington Rd SW is a home located in Floyd County with nearby schools including Coosa Middle School and Coosa High School.
Ownership History
Date
Name
Owned For
Owner Type
Purchase Details
Closed on
Jun 4, 2008
Sold by
Not Provided
Bought by
Banks Joseph R
Current Estimated Value
Home Financials for this Owner
Home Financials are based on the most recent Mortgage that was taken out on this home.
Original Mortgage
$80,000
Interest Rate
5.57%
Mortgage Type
New Conventional
Purchase Details
Closed on
Jun 26, 2003
Bought by
P and R
Purchase Details
Closed on
Jun 4, 1985
Sold by
P\R
Bought by
Berry Albert E
Purchase Details
Closed on
Feb 7, 1985
Sold by
P\R
Bought by
P\R
Purchase Details
Closed on
Feb 3, 1978
Sold by
Berry Albert E and Berry Sherry A
Bought by
P\R
Purchase Details
Closed on
Apr 21, 1977
Sold by
Toles C Max D/B/A Toles Const Co
Bought by
Berry Albert E and Berry Sherry A
Purchase Details
Closed on
Oct 28, 1976
Sold by
Sheron Toles Inc
Bought by
Toles C Max D/B/A Toles Const Co
Purchase Details
Closed on
May 19, 1972
Bought by
Sheron Toles Inc
Create a Home Valuation Report for This Property
The Home Valuation Report is an in-depth analysis detailing your home's value as well as a comparison with similar homes in the area
Home Values in the Area
Average Home Value in this Area
Purchase History
| Date | Buyer | Sale Price | Title Company |
|---|---|---|---|
| Banks Joseph R | $225,000 | -- | |
| Banks Joseph R | $225,000 | -- | |
| P | -- | -- | |
| Berry Albert E | -- | -- | |
| P\R | -- | -- | |
| P\R | -- | -- | |
| Berry Albert E | $82,000 | -- | |
| Toles C Max D/B/A Toles Const Co | $12,000 | -- | |
| Sheron Toles Inc | -- | -- |
Source: Public Records
Mortgage History
| Date | Status | Borrower | Loan Amount |
|---|---|---|---|
| Closed | Banks Joseph R | $80,000 |
Source: Public Records
Tax History Compared to Growth
Tax History
| Year | Tax Paid | Tax Assessment Tax Assessment Total Assessment is a certain percentage of the fair market value that is determined by local assessors to be the total taxable value of land and additions on the property. | Land | Improvement |
|---|---|---|---|---|
| 2024 | $5,000 | $156,372 | $32,921 | $123,451 |
| 2023 | $4,641 | $150,286 | $29,928 | $120,358 |
| 2022 | $3,890 | $125,390 | $24,820 | $100,570 |
| 2021 | $3,578 | $113,100 | $22,616 | $90,484 |
| 2020 | $3,584 | $112,632 | $19,666 | $92,966 |
| 2019 | $3,401 | $108,384 | $19,666 | $88,718 |
| 2018 | $3,239 | $102,994 | $18,730 | $84,264 |
| 2017 | $3,073 | $97,262 | $17,343 | $79,919 |
| 2016 | $2,927 | $91,240 | $17,320 | $73,920 |
| 2015 | $2,860 | $90,958 | $17,320 | $73,638 |
| 2014 | $2,860 | $90,958 | $17,320 | $73,638 |
Source: Public Records
Map
Nearby Homes
- 2 Kensington Rd SW
- 1 Windsor Rd SW
- 1 Huntington Rd SW
- 10 Horseshoe Bend Rd SW
- 0 Belle Meade Dr SW Unit 10504645
- 5 Saint Andrews Way SW
- 30 Fairview Dr SW
- 11 Brow Rd SW
- 0 Hidden Ridge Dr Unit 10556470
- 0 Hidden Ridge Dr Unit 10343706
- 0 Hidden Ridge Dr Unit 10343701
- 0 Hidden Ridge Dr Unit 10343700
- 0 Hidden Ridge Dr Unit 10343696
- 0 Hidden Ridge Dr Unit 10343694
- 0 Hidden Ridge Dr Unit 10343693
- 0 Hidden Ridge Dr Unit 10343689
- 0 Hidden Ridge Dr Unit 10343688
- 0 Hidden Ridge Dr Unit 10343685
- 0 Hidden Ridge Dr Unit 10343680
- 0 Hidden Ridge Dr Unit 10343676
- 6 Kensington Rd SW
- 0 Kensington Rd SW Unit 7139272
- 0 Kensington Rd SW Unit 8343023
- 0 Kensington Rd SW Unit 8303748
- 0 Kensington Rd SW Unit 7480713
- 0 Kensington Rd SW Unit 3104589
- 0 Kensington Rd SW
- 5 Kensington Rd SW
- 3 Kensington Rd SW
- 26 Huntington Rd SW
- 0 Huntington Rd SW Unit 8572394
- 0 Huntington Rd SW Unit 2889702
- 0 Huntington Rd SW Unit 8390387
- 0 Huntington Rd SW Unit 8577051
- 0 Huntington Rd SW Unit 9007272
- 0 Huntington Rd SW Unit 9046084
- 0 Huntington Rd SW Unit 8788540
- 0 Huntington Rd SW Unit 8857235
- 0 Huntington Rd SW Unit 2677825
- 0 Huntington Rd SW Unit 3271824