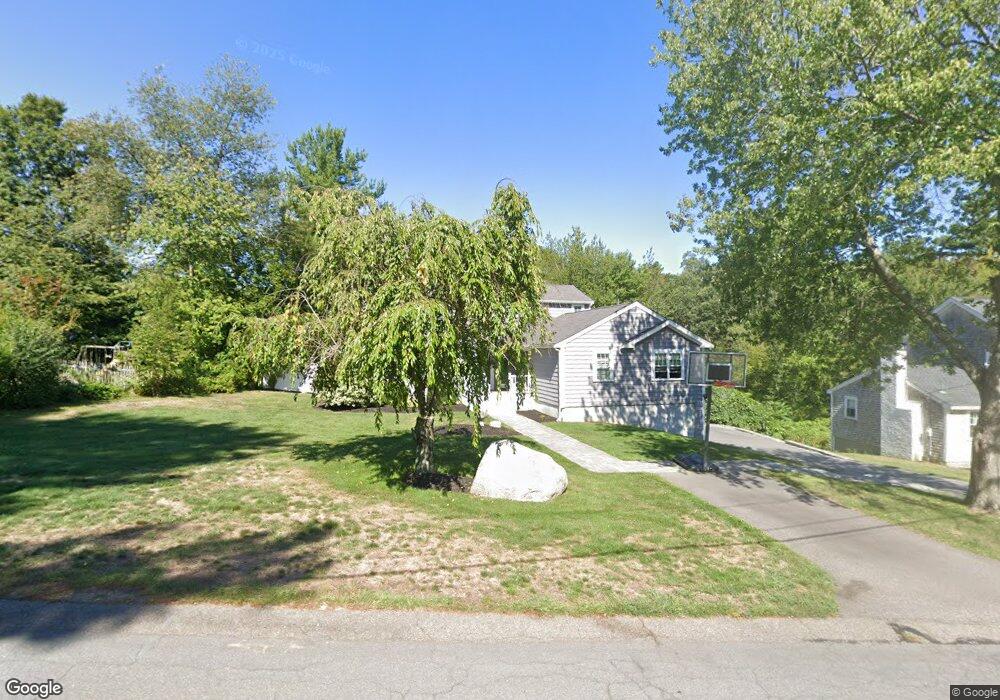
4 Knoll Rd Hingham, MA 02043
South Hingham NeighborhoodEstimated Value: $876,000 - $1,191,000
3
Beds
2
Baths
1,458
Sq Ft
$724/Sq Ft
Est. Value
About This Home
This home is located at 4 Knoll Rd, Hingham, MA 02043 and is currently estimated at $1,055,259, approximately $723 per square foot. 4 Knoll Rd is a home located in Plymouth County with nearby schools including South Elementary School, Hingham Middle School, and Hingham High School.
Ownership History
Date
Name
Owned For
Owner Type
Purchase Details
Closed on
Sep 10, 2007
Sold by
Healey Edward M and Healey Kim M
Bought by
Vogel Justin T and Vogel Marie L
Current Estimated Value
Home Financials for this Owner
Home Financials are based on the most recent Mortgage that was taken out on this home.
Original Mortgage
$344,000
Interest Rate
6.74%
Mortgage Type
Purchase Money Mortgage
Purchase Details
Closed on
Oct 9, 2001
Sold by
Fitzpatrick Rita M
Bought by
Healey Edward M and Healey Kim M
Create a Home Valuation Report for This Property
The Home Valuation Report is an in-depth analysis detailing your home's value as well as a comparison with similar homes in the area
Home Values in the Area
Average Home Value in this Area
Purchase History
| Date | Buyer | Sale Price | Title Company |
|---|---|---|---|
| Vogel Justin T | $430,000 | -- | |
| Healey Edward M | $305,000 | -- |
Source: Public Records
Mortgage History
| Date | Status | Borrower | Loan Amount |
|---|---|---|---|
| Open | Healey Edward M | $378,250 | |
| Closed | Healey Edward M | $344,000 |
Source: Public Records
Tax History
| Year | Tax Paid | Tax Assessment Tax Assessment Total Assessment is a certain percentage of the fair market value that is determined by local assessors to be the total taxable value of land and additions on the property. | Land | Improvement |
|---|---|---|---|---|
| 2025 | $11,117 | $1,039,900 | $337,400 | $702,500 |
| 2024 | $8,936 | $823,600 | $337,400 | $486,200 |
| 2023 | $7,618 | $761,800 | $313,300 | $448,500 |
| 2022 | $7,326 | $633,700 | $273,100 | $360,600 |
| 2021 | $7,114 | $602,900 | $273,100 | $329,800 |
| 2020 | $6,193 | $537,100 | $273,100 | $264,000 |
| 2019 | $6,149 | $520,700 | $273,100 | $247,600 |
| 2018 | $5,799 | $492,700 | $273,100 | $219,600 |
| 2017 | $5,454 | $445,200 | $281,100 | $164,100 |
| 2016 | $5,394 | $431,900 | $267,800 | $164,100 |
| 2015 | $4,838 | $386,100 | $236,900 | $149,200 |
Source: Public Records
Map
Nearby Homes
- 183 Gardner St
- 18 Whiting Ln
- 4 Kerri Ln
- 100 Whiting St
- 1 Kerri Ln
- 5 Old County Rd
- 17 Pine Haven Cir
- 22 Longmeadow Rd
- 18 Colby St
- 1276 Washington St Unit A
- 55 Turner Rd
- 2 Black Rock Dr Unit 21
- 2 Black Rock Dr
- 17 Elizabeth Ln Unit 17
- 15 Elizabeth Ln Unit 15
- 13 Elizabeth Ln Unit 13
- 9 Elizabeth Ln Unit 9
- 7 Elizabeth Ln Unit 7
- 5 Elizabeth Ln Unit 5
- 3 Elizabeth Ln Unit 3
- 6 Knoll Rd
- 2 Knoll Rd
- 215 Whiting St
- 5 Knoll Rd
- 3 Knoll Rd
- 1 Knoll Rd
- 221 Whiting St
- 209 Gardner St
- 225 Whiting St
- 205 Gardner St
- 460 Cushing St
- 229 Whiting St
- 454 Cushing St
- 210 Whiting St Unit 7
- 210 Whiting St Unit 5
- 213 Gardner St
- 222 Whiting St
- 215 Gardner St
- 215 Gardner St Unit 2
- 450 Cushing St
Your Personal Tour Guide
Ask me questions while you tour the home.