4 Kyle Ln Bentonville, AR 72712
Estimated Value: $1,103,000 - $1,461,000
4
Beds
5
Baths
3,286
Sq Ft
$396/Sq Ft
Est. Value
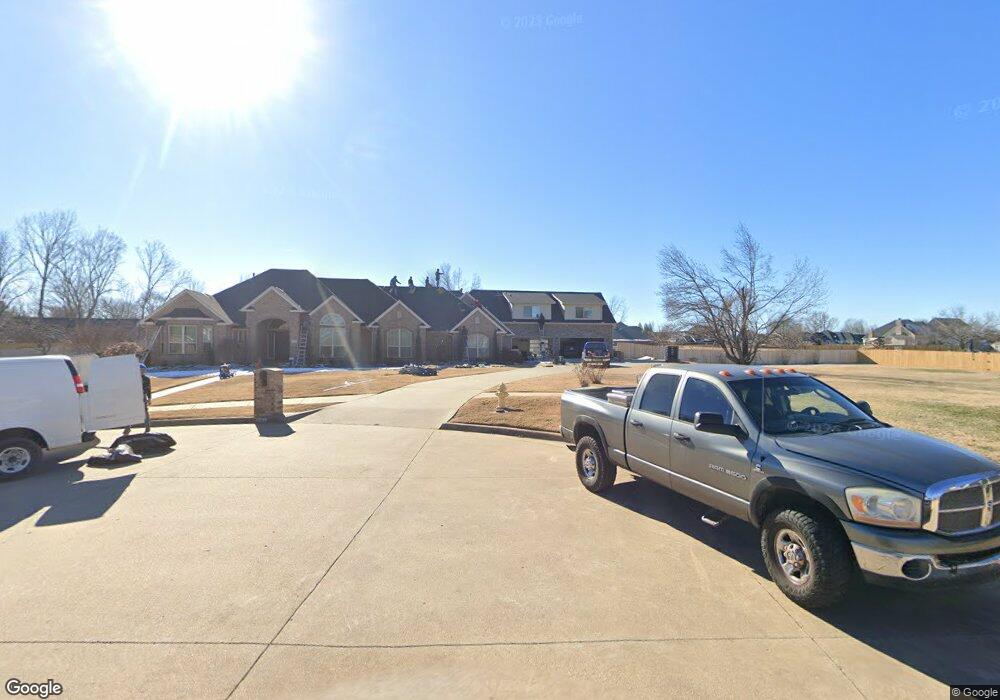
About This Home
This home is located at 4 Kyle Ln, Bentonville, AR 72712 and is currently estimated at $1,299,942, approximately $395 per square foot. 4 Kyle Ln is a home located in Benton County with nearby schools including Ruth Barker Middle School, Apple Glen Elementary School, and Washington Junior High School.
Ownership History
Date
Name
Owned For
Owner Type
Purchase Details
Closed on
Dec 28, 2011
Sold by
Starr Kirk W
Bought by
Lemaster Scott Andrew and Lemaster Eve Talbot
Current Estimated Value
Home Financials for this Owner
Home Financials are based on the most recent Mortgage that was taken out on this home.
Original Mortgage
$106,800
Outstanding Balance
$73,164
Interest Rate
4.04%
Mortgage Type
New Conventional
Estimated Equity
$1,226,778
Purchase Details
Closed on
May 7, 2011
Sold by
Starr Claudia B
Bought by
Starr Kirk W
Purchase Details
Closed on
Aug 15, 2008
Sold by
Martz John K and Martz Betty
Bought by
Starr Kirk W and Starr Claudia B
Home Financials for this Owner
Home Financials are based on the most recent Mortgage that was taken out on this home.
Original Mortgage
$62,500
Interest Rate
6.29%
Mortgage Type
Purchase Money Mortgage
Purchase Details
Closed on
Jun 23, 1999
Bought by
Martz
Create a Home Valuation Report for This Property
The Home Valuation Report is an in-depth analysis detailing your home's value as well as a comparison with similar homes in the area
Home Values in the Area
Average Home Value in this Area
Purchase History
| Date | Buyer | Sale Price | Title Company |
|---|---|---|---|
| Lemaster Scott Andrew | $452,000 | Mercury Title Llc | |
| Starr Kirk W | -- | None Available | |
| Starr Kirk W | $417,000 | At | |
| Martz | $50,000 | -- |
Source: Public Records
Mortgage History
| Date | Status | Borrower | Loan Amount |
|---|---|---|---|
| Open | Lemaster Scott Andrew | $106,800 | |
| Previous Owner | Starr Kirk W | $62,500 |
Source: Public Records
Tax History Compared to Growth
Tax History
| Year | Tax Paid | Tax Assessment Tax Assessment Total Assessment is a certain percentage of the fair market value that is determined by local assessors to be the total taxable value of land and additions on the property. | Land | Improvement |
|---|---|---|---|---|
| 2025 | $8,487 | $205,985 | $19,600 | $186,385 |
| 2024 | $8,138 | $205,985 | $19,600 | $186,385 |
| 2023 | $7,751 | $125,420 | $16,000 | $109,420 |
| 2022 | $7,564 | $125,420 | $16,000 | $109,420 |
| 2021 | $7,336 | $125,420 | $16,000 | $109,420 |
| 2020 | $5,609 | $88,060 | $8,400 | $79,660 |
| 2019 | $5,609 | $88,060 | $8,400 | $79,660 |
| 2018 | $5,609 | $88,060 | $8,400 | $79,660 |
| 2017 | $5,351 | $88,060 | $8,400 | $79,660 |
| 2016 | $5,351 | $88,060 | $8,400 | $79,660 |
| 2015 | $4,872 | $78,840 | $10,000 | $68,840 |
| 2014 | $4,872 | $73,650 | $10,000 | $63,650 |
Source: Public Records
Map
Nearby Homes
- 901 NE Mccollum Dr
- 501 NE Whitney St
- 1210 Rice Rd
- 1500 Linwood Cir
- 0 Rice Rd Unit 1291234
- 1210 Spring St
- 1615 Cresent St
- 1903 NE Steinbeck Dr
- 2512 SE 3rd St
- 1907 NE Steinbeck Dr
- 1810 NE Chaucer St
- 1905 NE Frost Dr
- 2801 SE 3rd St
- 2504 SE 4th St
- 1907 NE Frost Dr
- 1208 NE 3rd St
- 2709 Pleasant View Ln
- 2806 SE 3rd St
- 3000 NE Doyle Dr
- 2708 Pleasant View Ln