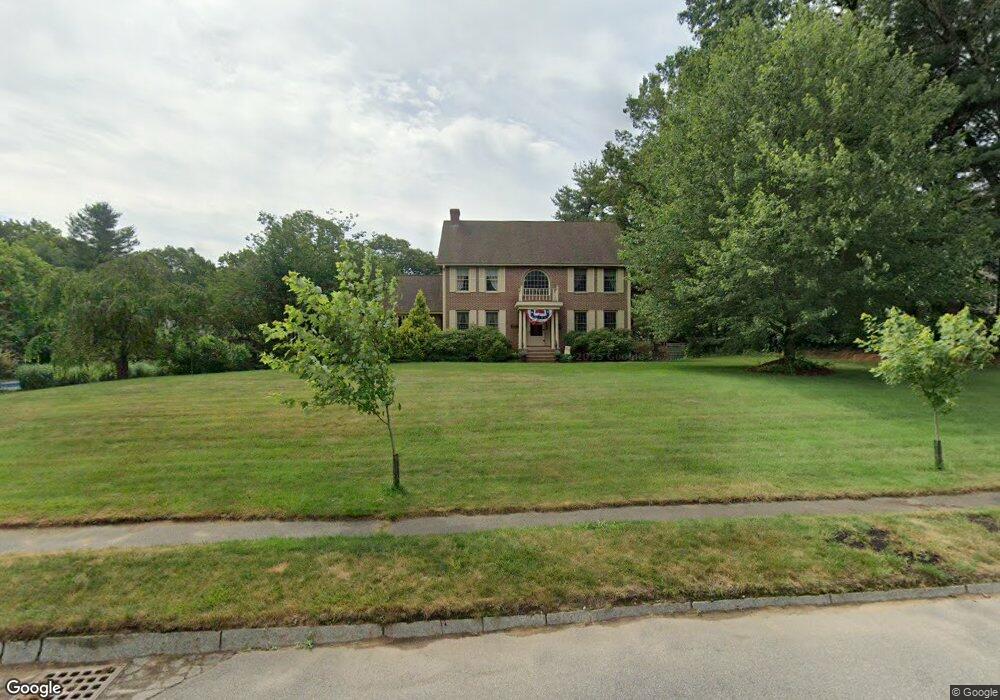
4 Kylemore Dr Westford, MA 01886
Estimated Value: $962,000 - $1,452,000
4
Beds
3
Baths
2,800
Sq Ft
$408/Sq Ft
Est. Value
About This Home
This home is located at 4 Kylemore Dr, Westford, MA 01886 and is currently estimated at $1,141,605, approximately $407 per square foot. 4 Kylemore Dr is a home located in Middlesex County with nearby schools including Rita E. Miller Elementary School, Day Elementary School, and Blanchard Middle School.
Ownership History
Date
Name
Owned For
Owner Type
Purchase Details
Closed on
Aug 16, 1996
Sold by
Chosiad David B and Thompson Paula D
Bought by
Shelgren Michael A and Mcknight Jennifer
Current Estimated Value
Purchase Details
Closed on
Oct 19, 1989
Sold by
Flaherty Patrick
Bought by
Chosiad David
Create a Home Valuation Report for This Property
The Home Valuation Report is an in-depth analysis detailing your home's value as well as a comparison with similar homes in the area
Home Values in the Area
Average Home Value in this Area
Purchase History
| Date | Buyer | Sale Price | Title Company |
|---|---|---|---|
| Shelgren Michael A | $336,000 | -- | |
| Chosiad David | $341,000 | -- |
Source: Public Records
Mortgage History
| Date | Status | Borrower | Loan Amount |
|---|---|---|---|
| Open | Chosiad David | $257,000 | |
| Closed | Chosiad David | $285,000 | |
| Closed | Chosiad David | $300,000 |
Source: Public Records
Tax History
| Year | Tax Paid | Tax Assessment Tax Assessment Total Assessment is a certain percentage of the fair market value that is determined by local assessors to be the total taxable value of land and additions on the property. | Land | Improvement |
|---|---|---|---|---|
| 2025 | $12,360 | $917,600 | $322,100 | $595,500 |
| 2024 | $12,415 | $901,600 | $330,500 | $571,100 |
| 2023 | $11,970 | $811,000 | $314,600 | $496,400 |
| 2022 | $12,488 | $774,700 | $277,100 | $497,600 |
| 2021 | $9,309 | $701,300 | $277,100 | $424,200 |
| 2020 | $11,491 | $703,700 | $277,100 | $426,600 |
| 2019 | $13,747 | $672,200 | $277,100 | $395,100 |
| 2018 | $10,669 | $659,400 | $267,300 | $392,100 |
| 2017 | $10,209 | $622,100 | $267,300 | $354,800 |
| 2016 | $10,222 | $627,100 | $270,000 | $357,100 |
| 2015 | $10,048 | $618,700 | $260,100 | $358,600 |
| 2014 | $9,630 | $580,100 | $250,200 | $329,900 |
Source: Public Records
Map
Nearby Homes
- 7 3rd St
- 3 Hillside Ave
- 11 River St
- 3 Cheyenne Valley Unit 3
- 35 Forge Village Rd
- 8 Bixby Ln
- 17 Maple St
- 23 Apache Way Unit 23
- 12 Patten Rd
- 66 Patten Rd
- 34 West St
- 82 Pleasant St
- 6 Colonel Rolls Dr
- 41 Flagg Rd
- 62 Main St
- 59 Main St
- 2 Lady Constance Way Unit 19
- 2 Wendell Place Unit 1
- 38 Groton Rd
- 4 Heywood Rd
Your Personal Tour Guide
Ask me questions while you tour the home.