
Landlord's Agent in 2024
Samir Genid
Realty One Group Legend, Clifton
(973) 271-1666
2 in this area
138 Total Sales
Estimated Value: $1,242,000 - $1,413,000
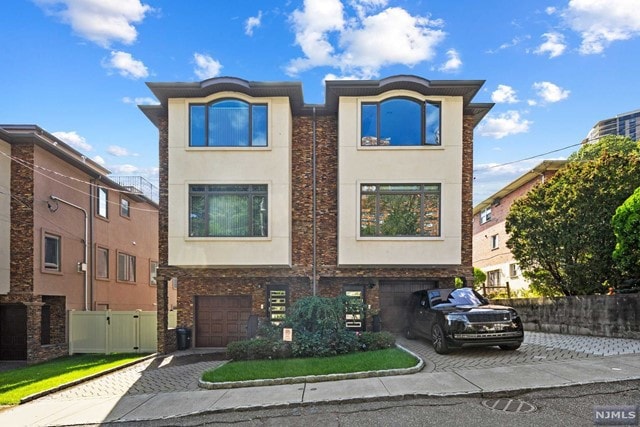
Welcome to 4 Leary Ln Unit B in Edgewater, NJ. This 3-bedroom, 3.5-bathroom 3,200 Square feet rental unit built in 2017 offers a comfortable and stylish living space. Open floor plan seamlessly connects the living room, dining area, and modern kitchen. The kitchen features stainless steel appliances and a breakfast bar. Both bedrooms are spacious, with the primary bedroom having an en-suite bathroom. Additional features include a finished basement with a gym, out door rooftop with NYC Views, a back yard with grass, security camera system and in-unit laundry. Conveniently located, this rental provides easy access to dining, shopping, and entertainment options. Commuting is a breeze with nearby highways and public transportation options. Don't miss the opportunity to make 4 Leary Ln Unit B your new home!
| Date | Buyer | Sale Price | Title Company |
|---|---|---|---|
| Premysler John | -- | None Available | |
| Halali Ruslana | $942,000 | None Available |
| Date | Event | Price | List to Sale | Price per Sq Ft | Prior Sale |
|---|---|---|---|---|---|
| 01/01/2024 01/01/24 | Rented | $6,800 | 0.0% | -- | |
| 11/20/2023 11/20/23 | Price Changed | $6,800 | -2.2% | -- | |
| 10/24/2023 10/24/23 | Price Changed | $6,950 | -7.3% | -- | |
| 10/09/2023 10/09/23 | For Rent | $7,500 | 0.0% | -- | |
| 03/07/2022 03/07/22 | Sold | $970,000 | -2.8% | -- | View Prior Sale |
| 02/04/2022 02/04/22 | Pending | -- | -- | -- | |
| 12/03/2021 12/03/21 | For Sale | $998,000 | -- | -- |
| Year | Tax Paid | Tax Assessment Tax Assessment Total Assessment is a certain percentage of the fair market value that is determined by local assessors to be the total taxable value of land and additions on the property. | Land | Improvement |
|---|---|---|---|---|
| 2025 | $17,115 | $1,104,800 | $294,100 | $810,700 |
| 2024 | $16,746 | $1,077,100 | $282,100 | $795,000 |
| 2023 | $16,523 | $1,048,600 | $271,400 | $777,200 |
| 2022 | $16,523 | $1,025,000 | $265,900 | $759,100 |
| 2021 | $18,373 | $816,300 | $217,800 | $598,500 |
| 2020 | $15,877 | $816,300 | $217,800 | $598,500 |
| 2019 | $15,477 | $816,300 | $217,800 | $598,500 |
| 2018 | $14,963 | $816,300 | $217,800 | $598,500 |
| 2017 | $14,693 | $816,300 | $217,800 | $598,500 |
| 2016 | $4,764 | $267,800 | $217,800 | $50,000 |
Landlord's Agent in 2024
Samir Genid
Realty One Group Legend, Clifton
(973) 271-1666
2 in this area
138 Total Sales
H
Tenant's Agent in 2024
Herbert Caceros
Onboard Real Estate New Jersey, LLC
(917) 797-7046
Seller's Agent in 2022
Elina Policastro
Prominent Properties Sotheby's International Realty-Edgewater
(201) 943-9400
16 in this area
34 Total Sales
J
Seller Co-Listing Agent in 2022
Julian Bargo
Prominent Properties Sotheby's International Realty-Edgewater
Source: New Jersey MLS
MLS Number: 23031150
APN: 13-00004-0000-00002-01-C004B
Disclaimer: Certain information contained herein is derived from information provided by parties other than Homes.com. All information provided is deemed reliable, but is not guaranteed to be accurate and should be independently verified.
![]() The data relating to the real estate for sale on this web site comes in part from the Internet Data Exchange Program of the NJMLS. Real estate listings held by brokerage firms other than Ten-X are marked with the Internet Data Exchange logo and information about them includes the name of the listing brokers. Some properties listed with the participating brokers do not appear on this website at the request of the seller. Listings of brokers that do not participate in Internet Data Exchange do not appear on this website.
The data relating to the real estate for sale on this web site comes in part from the Internet Data Exchange Program of the NJMLS. Real estate listings held by brokerage firms other than Ten-X are marked with the Internet Data Exchange logo and information about them includes the name of the listing brokers. Some properties listed with the participating brokers do not appear on this website at the request of the seller. Listings of brokers that do not participate in Internet Data Exchange do not appear on this website.
All information deemed reliable but not guaranteed. Source: New Jersey Multiple Listing, Inc.
© 2025 New Jersey Multiple Listing Service Inc. All rights reserved.